## Composite Image: Object Detection and Relationship Diagrams for "Professional" vs. "Family" Contexts
### Overview
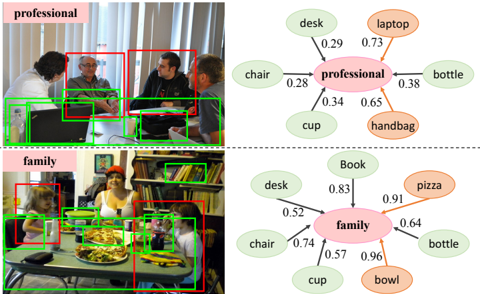
The image is a composite figure divided into two horizontal sections (top and bottom). Each section contains two elements: on the left, a photograph with object detection bounding boxes; on the right, a corresponding node-link diagram visualizing the relationships and association strengths between a central concept and various objects. The top section is labeled "professional," and the bottom section is labeled "family."
### Components/Axes
**Structure:**
- **Top Section:** Labeled "professional" in a pink box (top-left of the photo).
- **Bottom Section:** Labeled "family" in a pink box (top-left of the photo).
- Each photo has bounding boxes: **Red boxes** primarily outline people. **Green boxes** primarily outline objects.
- Each diagram is a star graph with a central pink node connected to surrounding object nodes. The connecting lines have numerical values. Object nodes are color-coded: **Green nodes** and **Orange nodes**.
**Diagram Labels & Values:**
*Top Diagram (Central Node: "professional")*
- Connected Objects (clockwise from top-right):
- `laptop` (orange node) - Value: `0.73`
- `bottle` (green node) - Value: `0.38`
- `handbag` (orange node) - Value: `0.65`
- `cup` (green node) - Value: `0.34`
- `chair` (green node) - Value: `0.28`
- `desk` (green node) - Value: `0.29`
*Bottom Diagram (Central Node: "family")*
- Connected Objects (clockwise from top-right):
- `pizza` (orange node) - Value: `0.91`
- `bottle` (green node) - Value: `0.64`
- `bowl` (orange node) - Value: `0.96`
- `cup` (green node) - Value: `0.57`
- `chair` (green node) - Value: `0.74`
- `desk` (green node) - Value: `0.52`
- `Book` (green node) - Value: `0.83` (Note: Capital 'B')
### Detailed Analysis
**Top Section - "Professional" Context:**
- **Photo:** Shows four people in an office-like setting around a table. Red boxes highlight the individuals. Green boxes highlight objects on the table and a chair.
- **Diagram Analysis:** The central concept "professional" is most strongly associated with `laptop` (0.73) and `handbag` (0.65). It has moderate association with `bottle` (0.38), `cup` (0.34), `desk` (0.29), and `chair` (0.28). The trend shows a stronger link to personal work/commute items (laptop, handbag) than to generic furniture or containers.
**Bottom Section - "Family" Context:**
- **Photo:** Shows a family (two adults, two children) gathered around a dining table with food. Red boxes highlight the people. Green boxes highlight objects like a chair, cup, and bookshelf items.
- **Diagram Analysis:** The central concept "family" shows very strong associations with food-related items: `bowl` (0.96) and `pizza` (0.91). It also has a strong link to `Book` (0.83). Associations with `chair` (0.74), `bottle` (0.64), `cup` (0.57), and `desk` (0.52) are also notably higher than in the professional context. The trend indicates a strong clustering around domestic, dining, and leisure activities.
### Key Observations
1. **Contextual Object Relevance:** The same object (`bottle`, `cup`, `chair`, `desk`) appears in both contexts but with different association strengths. For example, `chair` has a value of 0.28 in "professional" vs. 0.74 in "family."
2. **Distinctive Objects:** Each context has unique, high-value objects: `laptop` and `handbag` for "professional"; `pizza`, `bowl`, and `Book` for "family."
3. **Color Coding in Diagrams:** In both diagrams, objects that are more specific or consumable (laptop, handbag, pizza, bowl) are colored orange, while more generic or furniture items (desk, chair, cup, bottle, Book) are colored green. This may indicate a categorical distinction.
4. **Spatial Grounding:** The legend (color coding of nodes) is integrated directly into the diagram structure. The numerical values are placed on the connecting lines, closer to the central node.
### Interpretation
This image demonstrates a method for analyzing and visualizing how the semantic meaning of a scene (e.g., "professional" vs. "family") is constructed through the presence and co-occurrence of specific objects. The numerical values likely represent association strengths, confidence scores, or learned weights from a computer vision or knowledge graph model.
The data suggests that the model or analysis identifies "professional" contexts by a stronger link to individual productivity and mobility tools (laptop, handbag), while "family" contexts are defined by communal dining (pizza, bowl) and shared leisure (Book). The elevated scores for common objects like `chair` and `cup` in the family context imply they are more central or frequently detected in those scenes.
The clear separation in high-value objects between the two diagrams indicates the underlying system can effectively distinguish between these social contexts based on object recognition. The bounding boxes in the photos provide the visual evidence from which these abstract relationship diagrams are derived, showing a pipeline from raw image detection to higher-level conceptual understanding.