## Bar Chart: Data Source Weight Comparison
### Overview
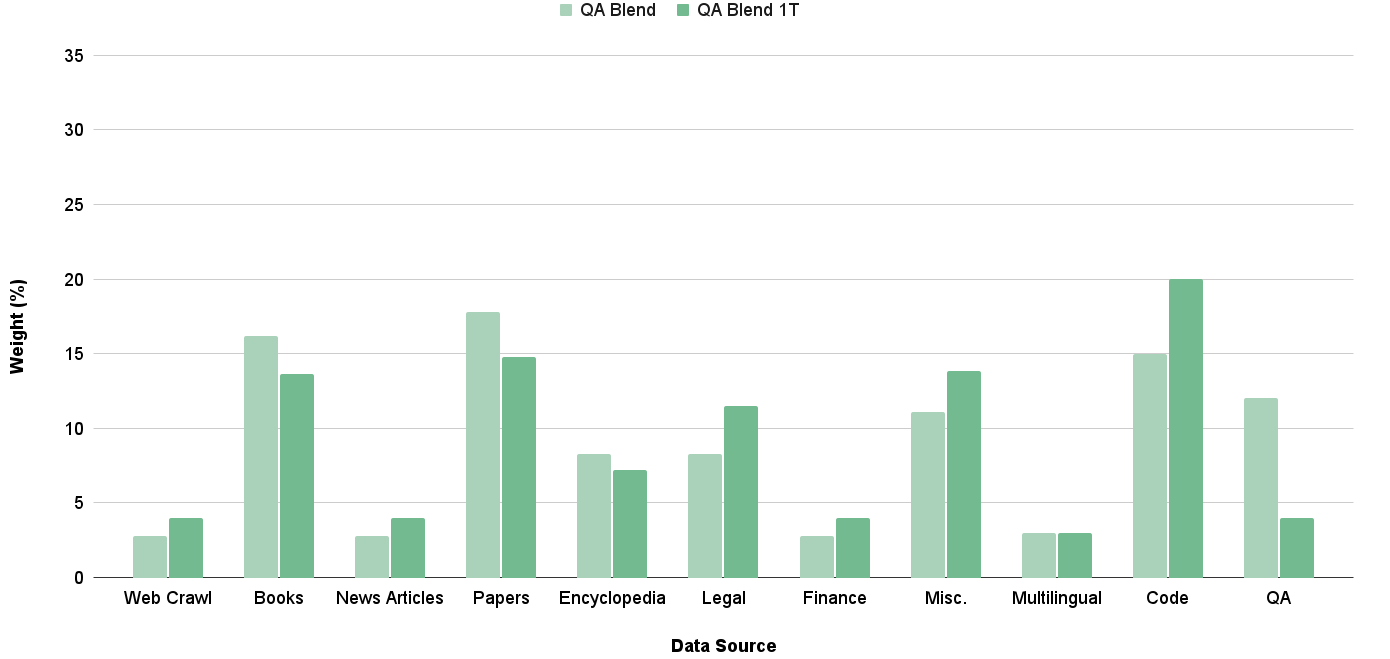
The image is a bar chart comparing the weight (in percentage) of different data sources for two categories: "QA Blend" and "QA Blend 1T". The chart displays the weight of each data source as a vertical bar, with the height of the bar representing the percentage.
### Components/Axes
* **Title:** There is no explicit title on the chart.
* **X-axis:** Labeled "Data Source". Categories include: Web Crawl, Books, News Articles, Papers, Encyclopedia, Legal, Finance, Misc., Multilingual, Code, QA.
* **Y-axis:** Labeled "Weight (%)". Scale ranges from 0 to 35, with tick marks at intervals of 5 (0, 5, 10, 15, 20, 25, 30, 35).
* **Legend:** Located at the top of the chart.
* "QA Blend" is represented by a light green bar.
* "QA Blend 1T" is represented by a dark green bar.
### Detailed Analysis
Here's a breakdown of the data for each data source, comparing "QA Blend" and "QA Blend 1T":
* **Web Crawl:**
* QA Blend: Approximately 3%
* QA Blend 1T: Approximately 4%
* **Books:**
* QA Blend: Approximately 16%
* QA Blend 1T: Approximately 14%
* **News Articles:**
* QA Blend: Approximately 3%
* QA Blend 1T: Approximately 4%
* **Papers:**
* QA Blend: Approximately 18%
* QA Blend 1T: Approximately 15%
* **Encyclopedia:**
* QA Blend: Approximately 8%
* QA Blend 1T: Approximately 7%
* **Legal:**
* QA Blend: Approximately 8%
* QA Blend 1T: Approximately 9%
* **Finance:**
* QA Blend: Approximately 3%
* QA Blend 1T: Approximately 4%
* **Misc.:**
* QA Blend: Approximately 11%
* QA Blend 1T: Approximately 14%
* **Multilingual:**
* QA Blend: Approximately 3%
* QA Blend 1T: Approximately 3%
* **Code:**
* QA Blend: Approximately 15%
* QA Blend 1T: Approximately 20%
* **QA:**
* QA Blend: Approximately 12%
* QA Blend 1T: Approximately 4%
### Key Observations
* The "Code" data source has the highest weight for "QA Blend 1T" (approximately 20%).
* The "Papers" data source has the highest weight for "QA Blend" (approximately 18%).
* "QA Blend 1T" generally has a higher weight for "Code" and "Misc." compared to "QA Blend".
* "QA Blend" generally has a higher weight for "Books", "Papers", and "QA" compared to "QA Blend 1T".
* "Multilingual" has the lowest weight for both "QA Blend" and "QA Blend 1T".
### Interpretation
The chart illustrates the relative importance of different data sources in two QA blends. The differences in weight between "QA Blend" and "QA Blend 1T" suggest that the composition or weighting of data sources varies between the two blends. For example, "QA Blend 1T" relies more heavily on "Code" and "Misc." data, while "QA Blend" relies more on "Papers" and "QA" data. This could indicate different strategies or priorities in the construction of these blends. The low weight of "Multilingual" data suggests it may be a less significant component in both blends. The data suggests that the two blends are constructed using different weightings of the data sources, which could lead to different performance characteristics.