## Bar Chart: QA Blend vs QA Blend 1T
### Overview
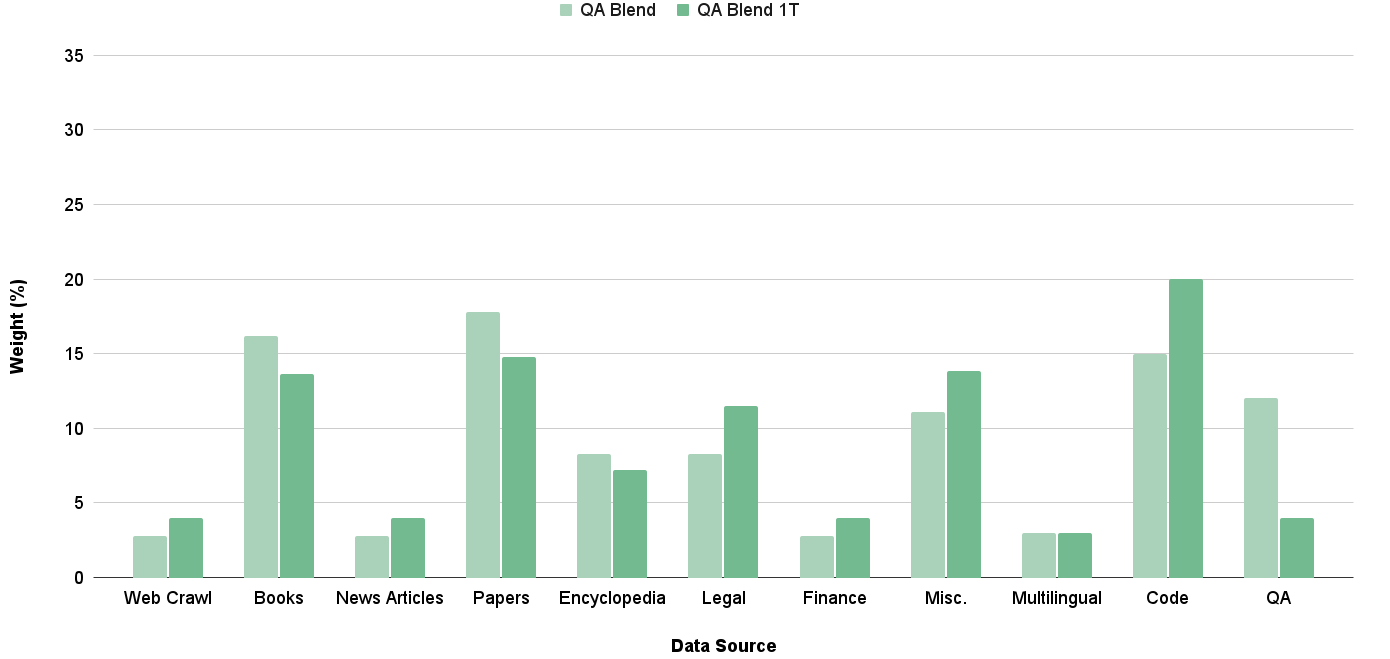
The chart compares the weight distribution (%) of two data sources, **QA Blend** (light green) and **QA Blend 1T** (dark green), across 11 categories. The y-axis represents weight in percentage (0–35%), and the x-axis lists categories such as Web Crawl, Books, Papers, etc. The legend is positioned at the top right, with QA Blend in light green and QA Blend 1T in dark green.
### Components/Axes
- **X-axis (Data Source)**: Categories include Web Crawl, Books, News Articles, Papers, Encyclopedia, Legal, Finance, Misc., Multilingual, Code, QA.
- **Y-axis (Weight %)**: Scaled from 0 to 35 in increments of 5.
- **Legend**: Top-right corner, with QA Blend (light green) and QA Blend 1T (dark green).
### Detailed Analysis
- **Web Crawl**: QA Blend (~3%), QA Blend 1T (~4%).
- **Books**: QA Blend (~16%), QA Blend 1T (~14%).
- **News Articles**: QA Blend (~3%), QA Blend 1T (~4%).
- **Papers**: QA Blend (~18%), QA Blend 1T (~15%).
- **Encyclopedia**: QA Blend (~8%), QA Blend 1T (~7%).
- **Legal**: QA Blend (~8%), QA Blend 1T (~12%).
- **Finance**: QA Blend (~3%), QA Blend 1T (~4%).
- **Misc.**: QA Blend (~11%), QA Blend 1T (~14%).
- **Multilingual**: QA Blend (~3%), QA Blend 1T (~3%).
- **Code**: QA Blend (~15%), QA Blend 1T (~20%).
- **QA**: QA Blend (~12%), QA Blend 1T (~4%).
### Key Observations
1. **QA Blend 1T** consistently has higher weights than **QA Blend** in most categories (e.g., Code, Legal, Misc.).
2. **Code** is the highest-weighted category for QA Blend 1T (~20%), while **QA** is the highest for QA Blend (~12%).
3. **Web Crawl, News Articles, Finance, and Multilingual** have the lowest weights for both data sources (~3–4%).
4. **QA Blend** shows a peak in **Papers** (~18%), while QA Blend 1T peaks in **Code** (~20%).
### Interpretation
- **QA Blend 1T** demonstrates broader utility across categories, with significant weight in **Code** and **Legal**, suggesting it may be optimized for technical or specialized data.
- **QA Blend** has a stronger presence in **Papers** and **QA**, indicating a focus on academic or direct question-answering tasks.
- The **QA** category is an outlier, where QA Blend outperforms QA Blend 1T, possibly reflecting a design choice to prioritize direct QA tasks in the original model.
- The **Multilingual** category shows equal weight for both, suggesting balanced performance in multilingual contexts.
- The **Finance** and **News Articles** categories have minimal weight, implying these sources are less critical to the models' training data.
### Trends Verification
- **QA Blend 1T** slopes upward in most categories compared to QA Blend, except for **QA** and **Encyclopedia**.
- **QA Blend** shows a bimodal distribution, with peaks in **Papers** and **QA**, while QA Blend 1T has a more uniform distribution.
### Component Isolation
- **Header**: Title and legend (top-right).
- **Main Chart**: Bar pairs for each category, with QA Blend (light green) and QA Blend 1T (dark green).
- **Footer**: No additional elements; focus remains on the bar chart.
### Final Notes
The chart highlights a strategic shift in data sourcing between the two models, with QA Blend 1T emphasizing technical and specialized domains. The QA category's divergence suggests a deliberate prioritization in the original QA Blend model.