## Line Chart: MER Average vs. N for Different Algorithms
### Overview
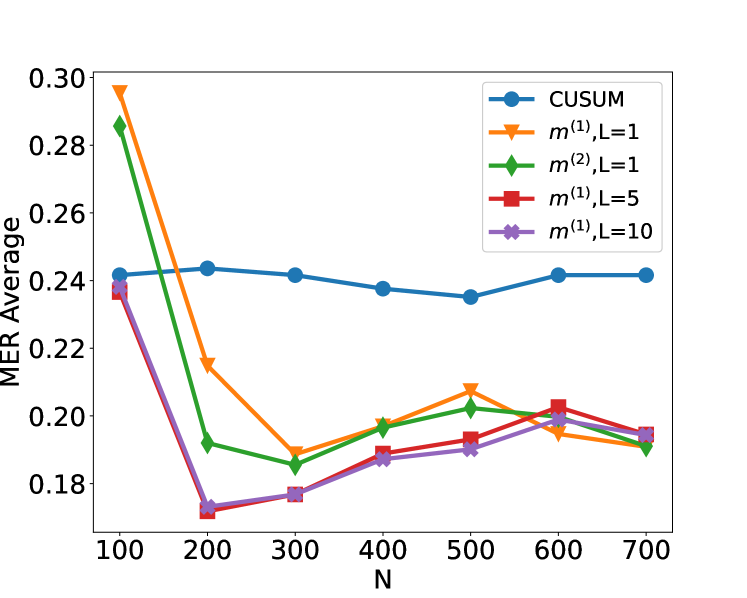
This image presents a line chart comparing the Mean Error Rate (MER) Average for different algorithms as a function of 'N'. The algorithms are CUSUM, m<sup>(1)</sup> with L=1, m<sup>(2)</sup> with L=1, m<sup>(1)</sup> with L=5, and m<sup>(1)</sup> with L=10. The chart displays how the MER Average changes as 'N' increases from 100 to 700.
### Components/Axes
* **X-axis:** Labeled "N". Scale ranges from approximately 100 to 700, with markers at 100, 200, 300, 400, 500, 600, and 700.
* **Y-axis:** Labeled "MER Average". Scale ranges from approximately 0.18 to 0.30, with markers at 0.18, 0.20, 0.22, 0.24, 0.26, 0.28, and 0.30.
* **Legend:** Located in the top-right corner. Contains the following labels and corresponding colors:
* CUSUM (Blue)
* m<sup>(1)</sup>, L=1 (Orange)
* m<sup>(2)</sup>, L=1 (Green)
* m<sup>(1)</sup>, L=5 (Red)
* m<sup>(1)</sup>, L=10 (Purple)
### Detailed Analysis
* **CUSUM (Blue Line):** The line starts at approximately 0.245 at N=100, decreases slightly to around 0.24 at N=200, remains relatively stable around 0.24 to 0.25 until N=600, and then increases slightly to approximately 0.245 at N=700.
* **m<sup>(1)</sup>, L=1 (Orange Line):** This line exhibits a steep downward trend from N=100 to N=200, decreasing from approximately 0.29 to 0.19. It then fluctuates between approximately 0.19 and 0.21 from N=200 to N=700.
* **m<sup>(2)</sup>, L=1 (Green Line):** The line starts at approximately 0.25 at N=100, decreases to around 0.21 at N=200, increases to approximately 0.215 at N=400, and then decreases slightly to around 0.205 at N=700.
* **m<sup>(1)</sup>, L=5 (Red Line):** This line shows a very steep decrease from approximately 0.29 at N=100 to approximately 0.16 at N=200. It then remains relatively stable, fluctuating between approximately 0.16 and 0.18 from N=200 to N=700.
* **m<sup>(1)</sup>, L=10 (Purple Line):** The line starts at approximately 0.25 at N=100, decreases to approximately 0.18 at N=200, and remains relatively stable, fluctuating between approximately 0.18 and 0.20 from N=200 to N=700.
### Key Observations
* The algorithms m<sup>(1)</sup>, L=5 and m<sup>(1)</sup>, L=1 show the most significant initial decrease in MER Average as N increases from 100 to 200.
* CUSUM exhibits the most stable MER Average across the range of N values.
* m<sup>(1)</sup>, L=1 and m<sup>(2)</sup>, L=1 show similar trends, but m<sup>(1)</sup>, L=1 generally has a lower MER Average.
* All algorithms converge to similar MER Average values as N approaches 700, with values between approximately 0.18 and 0.25.
### Interpretation
The chart demonstrates the performance of different algorithms in terms of Mean Error Rate (MER) as the input size 'N' increases. The rapid initial decrease in MER Average for algorithms m<sup>(1)</sup>, L=5 and m<sup>(1)</sup>, L=1 suggests that these algorithms benefit significantly from larger input sizes, potentially due to improved statistical power or more accurate parameter estimation. The stability of the CUSUM algorithm indicates its robustness to changes in input size. The convergence of all algorithms at higher N values suggests that the algorithms achieve similar performance levels when sufficient data is available. The parameter 'L' appears to influence the performance of the m<sup>(1)</sup> algorithm, with smaller values of L (L=1) generally resulting in lower MER Averages compared to larger values (L=10). This could indicate that a smaller 'L' value allows for faster detection of changes or anomalies. The chart provides valuable insights into the trade-offs between different algorithms and the importance of input size in achieving optimal performance.