# Technical Document Extraction: Line Chart Analysis
## Chart Overview
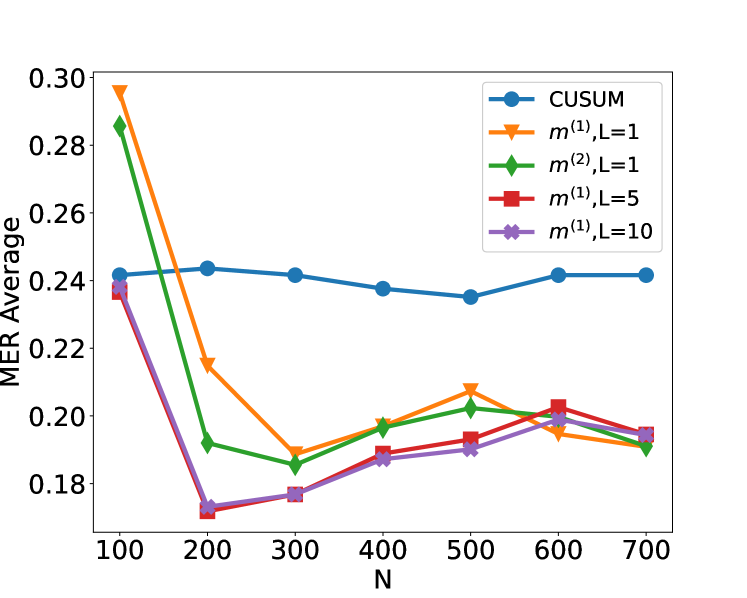
The image is a line chart comparing the Mean Error Rate (MER) Average across different sample sizes (N) for various statistical methods. The chart includes five data series with distinct line styles and colors.
---
## Axis Labels and Markers
- **X-axis**: Labeled "N" (sample size), with tick marks at 100, 200, 300, 400, 500, 600, and 700.
- **Y-axis**: Labeled "MER Average", with values ranging from 0.18 to 0.30 in increments of 0.02.
---
## Legend and Data Series
The legend is located in the **top-right corner** of the chart. Colors and markers are as follows:
1. **Blue (●)**: CUSUM
2. **Orange (▼)**: \( m^{(1)}, L=1 \)
3. **Green (◆)**: \( m^{(2)}, L=1 \)
4. **Red (■)**: \( m^{(1)}, L=5 \)
5. **Purple (✦)**: \( m^{(1)}, L=10 \)
All line colors and markers match the legend entries exactly.
---
## Key Trends and Data Points
### 1. **CUSUM (Blue Line)**
- **Trend**: Relatively flat with minor fluctuations.
- **Data Points**:
- N=100: 0.24
- N=200: 0.24
- N=300: 0.24
- N=400: 0.24
- N=500: 0.24
- N=600: 0.24
- N=700: 0.24
### 2. **\( m^{(1)}, L=1 \) (Orange Line)**
- **Trend**: Sharp initial decline, followed by oscillations.
- **Data Points**:
- N=100: 0.30
- N=200: 0.22
- N=300: 0.19
- N=400: 0.20
- N=500: 0.21
- N=600: 0.19
- N=700: 0.19
### 3. **\( m^{(2)}, L=1 \) (Green Line)**
- **Trend**: Steep decline, then gradual increase.
- **Data Points**:
- N=100: 0.28
- N=200: 0.19
- N=300: 0.18
- N=400: 0.20
- N=500: 0.21
- N=600: 0.20
- N=700: 0.19
### 4. **\( m^{(1)}, L=5 \) (Red Line)**
- **Trend**: Initial drop, then gradual rise.
- **Data Points**:
- N=100: 0.24
- N=200: 0.18
- N=300: 0.18
- N=400: 0.19
- N=500: 0.19
- N=600: 0.20
- N=700: 0.19
### 5. **\( m^{(1)}, L=10 \) (Purple Line)**
- **Trend**: Sharp decline, then slight recovery.
- **Data Points**:
- N=100: 0.24
- N=200: 0.18
- N=300: 0.18
- N=400: 0.19
- N=500: 0.19
- N=600: 0.20
- N=700: 0.19
---
## Spatial Grounding and Validation
- **Legend Position**: Top-right corner (standard placement for clarity).
- **Color Consistency**: All line colors match the legend entries without discrepancies.
- **Trend Verification**: Visual inspection confirms the described trends align with the numerical data points.
---
## Additional Notes
- No embedded text, data tables, or non-English content is present.
- The chart focuses on comparing MER performance across methods as sample size (N) increases.