## Diagram: Logic Tree Structure
### Overview
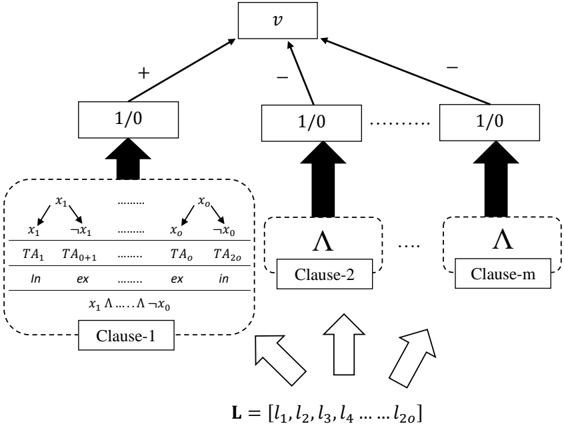
The image depicts a tree diagram representing a logical structure. It shows a root node 'v' branching out to several sub-nodes labeled '1/0'. These sub-nodes are connected to further logical components such as clauses and logical AND operations. The diagram illustrates a flow of logic from the bottom up, culminating in the root node 'v'.
### Components/Axes
* **Root Node:** A rectangle labeled 'v' at the top of the diagram.
* **Intermediate Nodes:** Rectangles labeled '1/0' connected to the root node.
* **Branches:** Lines connecting the root node to the intermediate nodes, labeled with '+' and '-'.
* **Clauses:** Dashed rectangles labeled 'Clause-1', 'Clause-2', ..., 'Clause-m'.
* **Logical AND:** Lambda symbol (Λ) within dashed rectangles above the clauses (except Clause-1).
* **Input Literals:** 'L = [l1, l2, l3, l4 ... l2o]' at the bottom, with arrows pointing upwards towards the clauses.
* **Truth Assignment (TA):** Table within the Clause-1 box showing 'TA1', 'TA0+1', 'TA0', 'TA2o' and their corresponding 'In' and 'ex' values.
* **Literals:** x1, ¬x1, x0, ¬x0 above the Truth Assignment table.
### Detailed Analysis
* **Root Node:** The root node 'v' represents the final logical outcome.
* **Intermediate Nodes:** The '1/0' nodes likely represent binary outcomes (True/False).
* **Branches:** The branches connecting 'v' to '1/0' are labeled with '+' and '-', possibly indicating positive and negative logical connections.
* **Clause-1:** Contains a table with literals x1, ¬x1, x0, ¬x0. Below these literals are truth assignments TA1, TA0+1, TA0, TA2o. Below the truth assignments are the values 'In' and 'ex'. The clause also contains the expression 'x1 Λ ... Λ ¬x0'.
* **Clause-2 to Clause-m:** Each of these clauses is associated with a logical AND operation (Λ).
* **Input Literals:** The input literals 'L = [l1, l2, l3, l4 ... l2o]' feed into the clauses.
* **Arrows:** Arrows indicate the direction of logical flow, generally from bottom to top.
### Key Observations
* The diagram represents a logical decision tree or circuit.
* Clause-1 has a more detailed structure compared to the other clauses.
* The input literals 'L' are the starting point of the logical evaluation.
* The truth assignments 'In' and 'ex' likely represent inclusion and exclusion of literals in the evaluation.
### Interpretation
The diagram illustrates a logical process where input literals 'L' are evaluated through a series of clauses. Clause-1 appears to be a special case with explicit truth assignments. The logical AND operations combine the results of the clauses, and the intermediate '1/0' nodes represent binary outcomes. The final result is represented by the root node 'v'. The '+' and '-' branches suggest that the outcome of each '1/0' node can either positively or negatively influence the final result 'v'. The entire structure likely represents a complex logical expression or a decision-making process.