## 3D Diagram: Intersecting Cylindrical Rods
### Overview
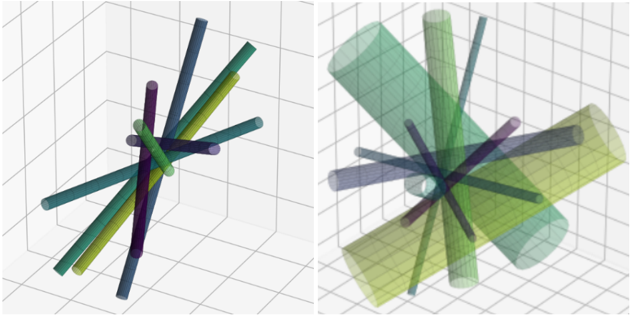
The image displays two side-by-side 3D plots within a wireframe grid environment. Each plot visualizes a cluster of colored cylindrical rods or tubes that all intersect at or near a common central point. The left plot shows the rods as solid, opaque objects. The right plot shows a similar arrangement but with the rods rendered as semi-transparent volumes, revealing their internal structure and a small central sphere at the intersection point. There is no textual information, labels, axes titles, legends, or numerical data present in the image.
### Components/Axes
* **Environment:** Both plots are set within a 3D Cartesian coordinate system represented by a light gray wireframe grid (cage). The grid defines the spatial boundaries but has no labeled axes, tick marks, or scales.
* **Primary Elements (Left Plot):** Approximately 10-12 solid, opaque cylindrical rods of varying colors and orientations. They radiate outward from a central region.
* **Primary Elements (Right Plot):** A similar set of approximately 10-12 cylindrical rods, rendered as semi-transparent volumes. A small, opaque, light-gray sphere is visible at the central intersection point.
* **Colors Observed:** The rods exhibit a palette including dark blue, teal, green, yellow-green, purple, and magenta. The colors are distinct but there is no legend to define their meaning.
* **Spatial Layout:** The rods are arranged in a starburst or urchin-like pattern, extending in multiple directions from the center, creating a complex, intersecting 3D structure.
### Detailed Analysis
* **Left Plot (Solid Rendering):**
* **Trend/Arrangement:** The rods are oriented along various vectors in 3D space. No single dominant axis is apparent. The structure appears roughly symmetrical but not perfectly so.
* **Visual Properties:** Rods have a matte or slightly glossy finish. Their intersections are occluded, making it difficult to trace individual rods through the cluster.
* **Data Points:** No numerical data is provided. The only "data" is the geometric configuration and color of the rods.
* **Right Plot (Transparent Rendering):**
* **Trend/Arrangement:** The spatial arrangement of the rods appears identical or very similar to the left plot. The key difference is the rendering style.
* **Visual Properties:** The transparency allows the viewer to see through the rods, revealing how they overlap and intersect internally. The central sphere becomes visible, suggesting it may be a point of origin, a joint, or a region of interest.
* **Data Points:** Again, no numerical data. The transparency provides additional *structural* information about the relationships between the components.
### Key Observations
1. **Absence of Textual Data:** The image contains zero text—no labels, titles, legends, or annotations. All information is purely graphical and geometric.
2. **Dual Representation:** The side-by-side comparison highlights the difference between an opaque surface view and a transparent volumetric view of the same or a very similar 3D structure.
3. **Central Focal Point:** All elements converge on a central area, emphasized by the sphere in the right-hand plot.
4. **Color Variety:** Multiple distinct colors are used for the rods, but without a legend, their significance (e.g., representing different categories, properties, or datasets) is unknown.
5. **Complex Spatial Relationships:** The intersecting rods create a dense, complex network that is difficult to parse in the solid view but becomes more intelligible in the transparent view.
### Interpretation
This image is a technical visualization, likely from a scientific, engineering, or computational geometry context. It demonstrates two methods for visualizing a complex 3D assembly of linear elements.
* **What it Suggests:** The diagrams are likely illustrating a concept such as:
* A **fiber reinforcement composite** material, where rods represent fibers in a matrix.
* A **molecular or atomic structure**, with rods as bonds and the central sphere as an atom.
* A **vector field** or **force diagram**, with rods representing directional vectors.
* A **geometric algorithm** output, showing intersecting primitives.
* A **medical or biological model**, such as neural pathways or cytoskeletal structures.
* **Relationship Between Elements:** The core relationship is spatial intersection. The left plot shows the external form, while the right plot reveals the internal connectivity and the central node (sphere) that may govern the assembly.
* **Notable Anomalies:** The primary "anomaly" is the complete lack of explanatory text, which makes definitive interpretation impossible. The value of the visualization is in its comparative rendering technique—showing how transparency can elucidate complex internal relationships that are hidden in a solid view.
* **Peircean Investigation:** From a semiotic perspective, the image is an **icon** (it resembles a physical structure) and a **diagram** (it abstractly represents relationships between parts). The missing **symbol** layer (text, labels) prevents a full, unambiguous reading. The viewer must infer meaning based on visual conventions common in technical fields. The side-by-side presentation itself is a symbolic act, instructing the viewer to compare and contrast the two visual modes.
**Conclusion:** The image provides rich geometric and comparative visual information about a 3D structure but contains no extractable factual data, metrics, or labels. Its informational content is purely about form, spatial arrangement, and visualization technique. To derive specific meaning, external context or an accompanying legend would be required.