## 3D Geometric Diagram: Intersecting Cylindrical Structures
### Overview
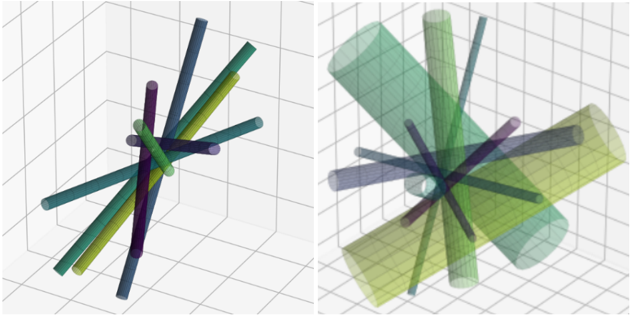
The image contains two 3D diagrams depicting intersecting cylindrical structures. Both diagrams use a grid-based coordinate system (X, Y, Z axes) to represent spatial relationships. The left diagram shows smaller, solid-colored cylinders, while the right diagram features larger, semi-transparent cylinders with overlapping layers. No explicit textual labels, legends, or axis titles are visible in the image.
### Components/Axes
- **Grid System**:
- A 3D Cartesian grid (X, Y, Z axes) forms the background, with grid lines in light gray.
- No numerical axis markers or scales are visible.
- **Cylindrical Structures**:
- **Left Diagram**:
- 8–10 thin, solid-colored cylinders (colors: teal, green, purple, blue).
- Cylinders intersect at various angles, creating a chaotic, overlapping arrangement.
- **Right Diagram**:
- 6–8 thicker, semi-transparent cylinders (colors: green, blue, purple, yellow).
- Cylinders are more densely packed, with overlapping layers creating a sense of depth.
### Detailed Analysis
- **Color Coding**:
- Colors appear to differentiate data sets or categories, but no legend is present to confirm this.
- Left diagram uses distinct, saturated colors; right diagram uses similar colors but with transparency.
- **Transparency**:
- Right diagram’s semi-transparent cylinders suggest layered data or overlapping values.
- **Spatial Arrangement**:
- Left diagram: Cylinders are more dispersed, with minimal overlap.
- Right diagram: Cylinders are clustered, with significant overlap and depth perception.
### Key Observations
1. **No Textual Elements**: The image contains no labels, legends, or axis titles.
2. **Color Consistency**: Colors in both diagrams align (e.g., teal, green, purple), suggesting a shared categorical system.
3. **Size and Transparency Differences**:
- Left diagram: Smaller, solid cylinders.
- Right diagram: Larger, semi-transparent cylinders.
4. **Overlap Patterns**:
- Left diagram: Minimal overlap, emphasizing individual structures.
- Right diagram: Heavy overlap, emphasizing spatial relationships.
### Interpretation
The diagrams likely represent a comparative visualization of spatial data, where:
- **Left Diagram**: Highlights individual components or discrete data points.
- **Right Diagram**: Emphasizes density, overlap, or hierarchical relationships through transparency and size.
- **Color Usage**: Colors may encode categories (e.g., data types, groups), but without a legend, this remains speculative.
- **Grid System**: The absence of numerical scales suggests the focus is on qualitative spatial relationships rather than quantitative measurements.
The lack of textual annotations implies the diagrams prioritize visual storytelling over explicit data labeling. The transition from solid to semi-transparent cylinders could symbolize a shift from discrete to continuous data representation.