## Diagram: Pair Supervised Fine-Tuning & Online Reinforcement Learning
### Overview
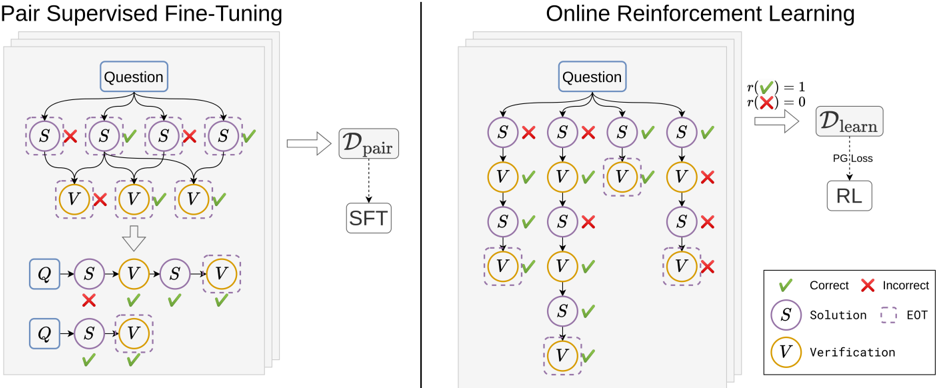
The image presents a comparative diagram illustrating two machine learning approaches: Pair Supervised Fine-Tuning (SFT) and Online Reinforcement Learning (RL). Both diagrams depict a process starting with a "Question" and progressing through a series of "Solution" (S) and "Verification" (V) steps. The left side shows SFT, where the process is guided by paired data, while the right side shows RL, where the process is guided by rewards and penalties.
### Components/Axes
The diagram consists of two main sections, each with a similar structure. Key components include:
* **Question:** The initial input to the system.
* **Solution (S):** Represents a step towards answering the question. Visually represented by a circle with the letter "S" inside.
* **Verification (V):** Represents the evaluation of a solution step. Visually represented by a circle with the letter "V" inside.
* **Correct/Incorrect Indicators:** Green checkmarks (✓) indicate correct steps, while red crosses (✗) indicate incorrect steps.
* **D<sub>pair</sub>:** Represents the paired dataset used in SFT.
* **D<sub>learn</sub>:** Represents the learning dataset used in RL.
* **SFT:** Label for Pair Supervised Fine-Tuning.
* **RL:** Label for Reinforcement Learning.
* **PG_Loss:** Policy Gradient Loss.
* **r<sup>+</sup>(x) = 1, r<sup>-</sup>(x) = 0:** Reward function definition.
* **EOT:** End of Thought.
* **Legend:** Located in the bottom-right corner, defining the meaning of the checkmark and cross symbols, as well as the Solution and Verification nodes.
### Detailed Analysis / Content Details
**Pair Supervised Fine-Tuning (Left Side):**
* The process begins with a "Question" node at the top.
* From the "Question", multiple "Solution" (S) nodes branch out, each connected to a "Verification" (V) node.
* The first four "S-V" pairs are marked with red crosses (✗) indicating incorrect steps.
* The next "S-V" pair is marked with a green checkmark (✓) indicating a correct step.
* The final "S-V" pair is also marked with a green checkmark (✓) indicating a correct step.
* An arrow points downwards from the initial "Question" and "S-V" pairs to a simplified representation of the process: "Q -> S -> V -> V".
* Another arrow points downwards from "Q -> S -> V -> V" to "Q -> S -> V", indicating a further simplification.
* An arrow labeled "D<sub>pair</sub>" points from the initial branching structure to the "SFT" label.
**Online Reinforcement Learning (Right Side):**
* The process begins with a "Question" node at the top.
* From the "Question", multiple "Solution" (S) nodes branch out, each connected to a "Verification" (V) node.
* The first three "S-V" pairs are marked with green checkmarks (✓) indicating correct steps.
* The next "S-V" pair is marked with a red cross (✗) indicating an incorrect step.
* The following "S-V" pair is marked with a green checkmark (✓) indicating a correct step.
* The final "S-V" pair is marked with a red cross (✗) indicating an incorrect step.
* An arrow labeled "D<sub>learn</sub>" points from the branching structure to a box containing "PG_Loss" and "RL".
* Above the arrow, the reward function is defined: "r<sup>+</sup>(x) = 1, r<sup>-</sup>(x) = 0".
### Key Observations
* SFT relies on a pre-defined, paired dataset (D<sub>pair</sub>) to guide the learning process, resulting in a simplified output.
* RL uses a learning dataset (D<sub>learn</sub>) and a reward function to guide the learning process, utilizing Policy Gradient Loss within a Reinforcement Learning framework.
* The SFT process appears to converge more quickly to a simplified solution, while the RL process explores more possibilities before reaching a solution.
* The number of "S-V" pairs is the same in both diagrams.
* The proportion of correct and incorrect steps differs between the two approaches. SFT has more initial incorrect steps, while RL has a more mixed result.
### Interpretation
The diagram illustrates the fundamental difference between supervised learning (SFT) and reinforcement learning (RL). SFT learns from labeled examples, aiming to mimic the correct solutions provided in the dataset. This leads to a more direct path to a simplified solution. RL, on the other hand, learns through trial and error, receiving rewards for correct actions and penalties for incorrect ones. This allows it to explore a wider range of possibilities but may require more iterations to converge. The reward function (r<sup>+</sup>(x) = 1, r<sup>-</sup>(x) = 0) indicates a binary reward system: a reward of 1 for correct steps and 0 for incorrect steps. The diagram suggests that SFT is more efficient when a high-quality, labeled dataset is available, while RL is more suitable for problems where labeled data is scarce or the optimal solution is unknown. The "EOT" label suggests that the process is iterative and continues until a satisfactory solution is reached. The diagram is a conceptual illustration and does not provide specific numerical data or performance metrics.