## Scatter Plot: Correlation Length vs. Beta
### Overview
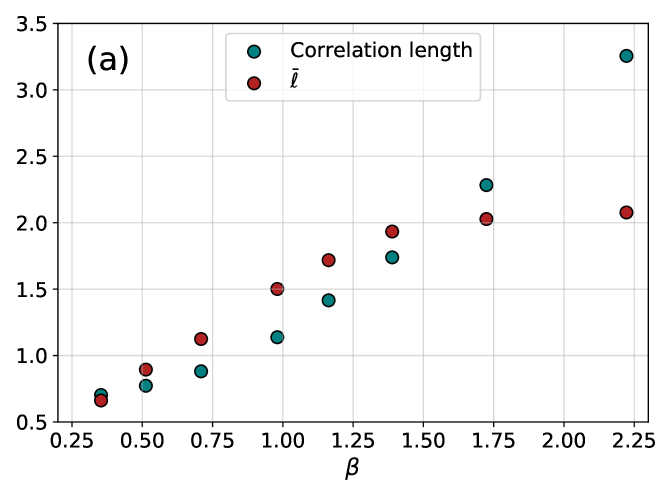
The image is a scatter plot showing the relationship between "Correlation length" and "l̄" (l-bar) as a function of "β" (beta). Both "Correlation length" and "l̄" generally increase as "β" increases. The plot includes a legend in the top-right corner and the label "(a)" in the top-left corner.
### Components/Axes
* **X-axis (Horizontal):** β (beta), with scale markers at 0.25, 0.50, 0.75, 1.00, 1.25, 1.50, 1.75, 2.00, and 2.25.
* **Y-axis (Vertical):** No explicit label, but the data represents "Correlation length" and "l̄". Scale markers are at 0.5, 1.0, 1.5, 2.0, 2.5, 3.0, and 3.5.
* **Legend (Top-Right):**
* Teal/Cyan: Correlation length
* Red: l̄ (l-bar)
* **Plot Title:** Labeled with "(a)" in the top-left corner.
### Detailed Analysis
**Correlation Length (Teal/Cyan):** The correlation length generally increases with beta.
* β = 0.375, Correlation length ≈ 0.7
* β = 0.5, Correlation length ≈ 0.8
* β = 0.75, Correlation length ≈ 0.9
* β = 1.0, Correlation length ≈ 1.15
* β = 1.25, Correlation length ≈ 1.4
* β = 1.5, Correlation length ≈ 1.75
* β = 1.75, Correlation length ≈ 2.3
* β = 2.25, Correlation length ≈ 3.3
**l̄ (l-bar) (Red):** The l̄ also generally increases with beta.
* β = 0.375, l̄ ≈ 0.7
* β = 0.5, l̄ ≈ 0.9
* β = 0.75, l̄ ≈ 1.1
* β = 1.0, l̄ ≈ 1.5
* β = 1.25, l̄ ≈ 1.75
* β = 1.5, l̄ ≈ 1.95
* β = 1.75, l̄ ≈ 2.05
* β = 2.25, l̄ ≈ 2.1
### Key Observations
* Both "Correlation length" and "l̄" exhibit a positive correlation with "β".
* The "Correlation length" appears to increase more rapidly than "l̄" at higher values of "β".
* The data points are somewhat scattered, suggesting some variability in the relationship.
### Interpretation
The scatter plot suggests that as the value of "β" increases, both the "Correlation length" and "l̄" tend to increase. This indicates a positive relationship between "β" and these two parameters. The difference in the rate of increase at higher "β" values might indicate a changing dynamic between the parameters as "β" increases. The scatter in the data points could be due to experimental error, other influencing factors not accounted for in the plot, or inherent variability in the system being studied.