## Line Chart: Ratios of the current Pareto front size for solving OneMinMax
### Overview
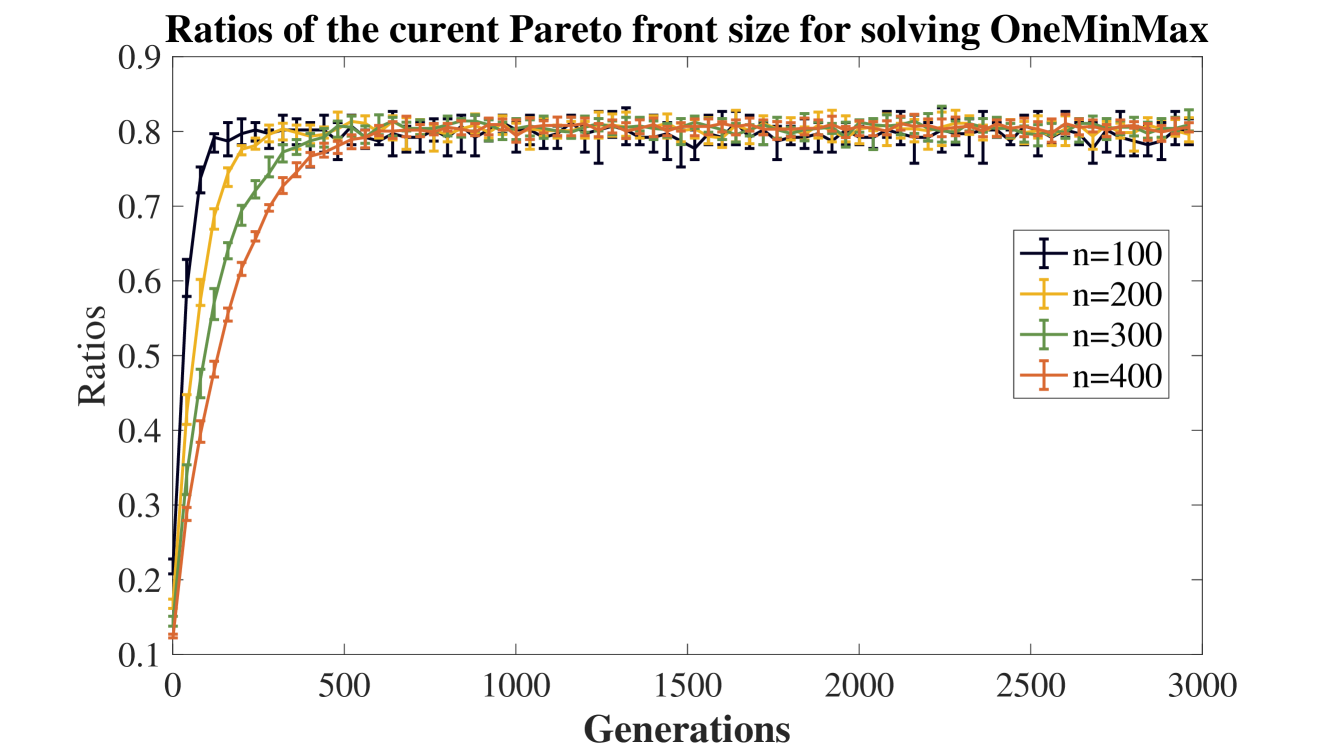
The image is a line chart that displays the ratios of the current Pareto front size for solving the OneMinMax problem across different generations. The chart compares the performance for different values of 'n' (100, 200, 300, and 400). The x-axis represents the number of generations, and the y-axis represents the ratios. Error bars are present on each data point.
### Components/Axes
* **Title:** Ratios of the current Pareto front size for solving OneMinMax
* **X-axis:**
* Label: Generations
* Scale: 0 to 3000, with markers at 0, 500, 1000, 1500, 2000, 2500, and 3000.
* **Y-axis:**
* Label: Ratios
* Scale: 0.1 to 0.9, with markers at 0.1, 0.2, 0.3, 0.4, 0.5, 0.6, 0.7, 0.8, and 0.9.
* **Legend:** Located on the right side of the chart.
* Blue: n=100
* Yellow: n=200
* Green: n=300
* Orange: n=400
### Detailed Analysis
* **Blue Line (n=100):**
* Trend: The line starts at approximately 0.2 and rises sharply, reaching a plateau around 0.8 after approximately 500 generations. The line then remains relatively stable with small fluctuations and error bars.
* Data Points: Starts around 0.2, reaches approximately 0.8 around 500 generations, and stabilizes around 0.8.
* **Yellow Line (n=200):**
* Trend: The line starts at approximately 0.15 and rises sharply, reaching a plateau around 0.8 after approximately 500 generations. The line then remains relatively stable with small fluctuations and error bars.
* Data Points: Starts around 0.15, reaches approximately 0.8 around 500 generations, and stabilizes around 0.8.
* **Green Line (n=300):**
* Trend: The line starts at approximately 0.13 and rises sharply, reaching a plateau around 0.8 after approximately 500 generations. The line then remains relatively stable with small fluctuations and error bars.
* Data Points: Starts around 0.13, reaches approximately 0.8 around 500 generations, and stabilizes around 0.8.
* **Orange Line (n=400):**
* Trend: The line starts at approximately 0.12 and rises sharply, reaching a plateau around 0.8 after approximately 500 generations. The line then remains relatively stable with small fluctuations and error bars.
* Data Points: Starts around 0.12, reaches approximately 0.8 around 500 generations, and stabilizes around 0.8.
### Key Observations
* All lines show a similar trend: a rapid increase in the ratio during the initial generations, followed by a plateau.
* The lines for different 'n' values converge to approximately the same ratio (around 0.8) after a certain number of generations.
* The error bars indicate some variability in the ratios, but the overall trend remains consistent.
* The initial rise is steepest for n=100 (blue line) and least steep for n=400 (orange line).
### Interpretation
The chart suggests that the ratio of the current Pareto front size for solving the OneMinMax problem increases rapidly in the early generations and then stabilizes. The value of 'n' influences the initial rate of increase, but after a certain number of generations (approximately 500), the ratios converge to a similar value regardless of 'n'. This indicates that the algorithm's performance, as measured by this ratio, becomes less sensitive to the value of 'n' as the number of generations increases. The error bars suggest that there is some variability in the results, but the overall trend is consistent across different runs. The data demonstrates that increasing the number of generations beyond a certain point does not significantly improve the ratio of the current Pareto front size.