\n
## Line Chart: Ratios of the current Pareto front size for solving OneMinMax
### Overview
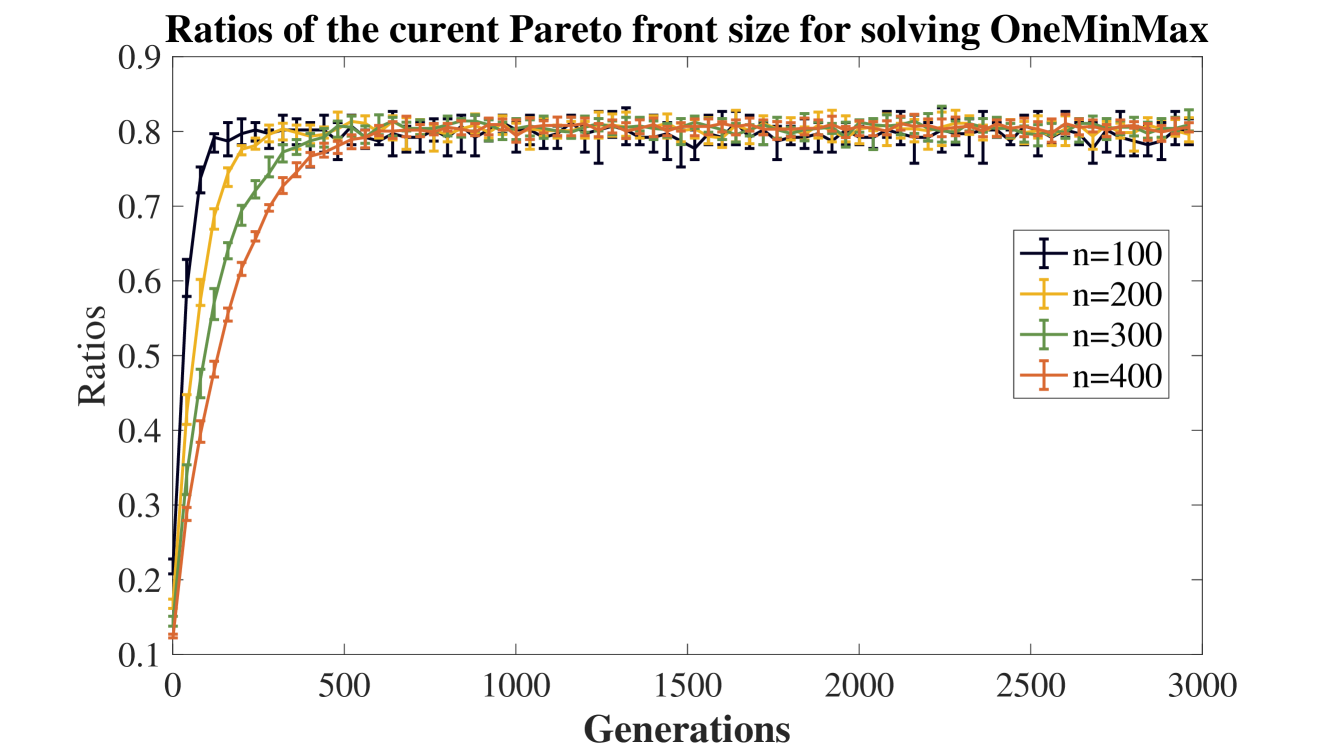
This is a line chart with error bars, plotting the ratio of the current Pareto front size against the number of generations for an optimization problem called "OneMinMax." The chart compares the performance across four different problem sizes, denoted by `n`. The data shows a rapid initial increase in the ratio, followed by a plateau, with smaller problem sizes converging faster.
### Components/Axes
* **Title:** "Ratios of the current Pareto front size for solving OneMinMax"
* **X-Axis:** Labeled "Generations". The scale runs from 0 to 3000, with major tick marks at intervals of 500 (0, 500, 1000, 1500, 2000, 2500, 3000).
* **Y-Axis:** Labeled "Ratios". The scale runs from 0.1 to 0.9, with major tick marks at intervals of 0.1.
* **Legend:** Positioned in the middle-right area of the chart. It defines four data series:
* `n=100`: Dark blue line with error bars.
* `n=200`: Yellow line with error bars.
* `n=300`: Green line with error bars.
* `n=400`: Orange-red line with error bars.
* **Data Series:** Each series is represented by a solid line connecting data points, with vertical error bars at each point indicating variability or confidence intervals.
### Detailed Analysis
**Trend Verification & Data Points (Approximate):**
All four series follow the same general trend: a steep, concave-down increase from generation 0, transitioning to a near-horizontal plateau. The rate of initial increase is inversely related to `n`.
1. **n=100 (Dark Blue):**
* **Trend:** The fastest initial rise. Reaches the plateau region first.
* **Key Points:** Starts at ~0.15 (Gen 0). Crosses 0.7 by ~Gen 100. Reaches ~0.8 by ~Gen 300. Plateaus around 0.80-0.82 from Gen 500 onward.
2. **n=200 (Yellow):**
* **Trend:** Slower initial rise than n=100, but faster than n=300 and n=400.
* **Key Points:** Starts at ~0.12 (Gen 0). Crosses 0.7 by ~Gen 200. Reaches ~0.8 by ~Gen 500. Plateaus around 0.80-0.81 from Gen 750 onward.
3. **n=300 (Green):**
* **Trend:** Slower initial rise than n=200.
* **Key Points:** Starts at ~0.11 (Gen 0). Crosses 0.7 by ~Gen 300. Reaches ~0.8 by ~Gen 750. Plateaus around 0.80 from Gen 1000 onward.
4. **n=400 (Orange-Red):**
* **Trend:** The slowest initial rise.
* **Key Points:** Starts at ~0.10 (Gen 0). Crosses 0.7 by ~Gen 400. Reaches ~0.8 by ~Gen 1000. Plateaus around 0.79-0.80 from Gen 1250 onward.
**Error Bars:** The error bars are relatively consistent in size across the plateau region for all series, suggesting stable variance in the ratio after convergence. The bars for `n=100` appear slightly larger in the early generations (0-500) compared to later ones.
### Key Observations
1. **Convergence to a Common Limit:** All four problem sizes (`n=100, 200, 300, 400`) converge to a very similar ratio value, approximately **0.80**, in the long run (after ~1250 generations).
2. **Scalability Trend:** The number of generations required to reach the 0.8 ratio threshold increases with problem size `n`. The relationship appears roughly linear: `n=100` (~300 gen), `n=200` (~500 gen), `n=300` (~750 gen), `n=400` (~1000 gen).
3. **Initial Condition:** The starting ratio at generation 0 decreases slightly as `n` increases (from ~0.15 for n=100 to ~0.10 for n=400).
4. **Plateau Stability:** Once the plateau is reached, the ratio remains remarkably stable with only minor fluctuations for the remainder of the 3000 generations shown.
### Interpretation
This chart demonstrates the performance of an evolutionary or genetic algorithm applied to the "OneMinMax" problem, a common benchmark in multi-objective optimization. The "Pareto front size ratio" likely measures how close the algorithm's found solutions are to the theoretical maximum number of non-dominated solutions.
The key insight is that the algorithm is **effective and scalable**. It consistently finds a high proportion (≈80%) of the maximum possible Pareto front size for all tested problem scales. The primary cost of scaling the problem (increasing `n`) is a **proportional increase in computational effort** (generations needed), not a degradation in final solution quality. The rapid initial improvement suggests the algorithm quickly discovers the broad structure of the Pareto front, with later generations devoted to refinement and maintaining diversity. The consistent error bars indicate the algorithm's performance is reliable across different runs. The convergence to the same limit implies the algorithm's effectiveness is not fundamentally limited by problem size within this range.