## Line Chart: Ratios of the current Pareto front size for solving OneMinMax
### Overview
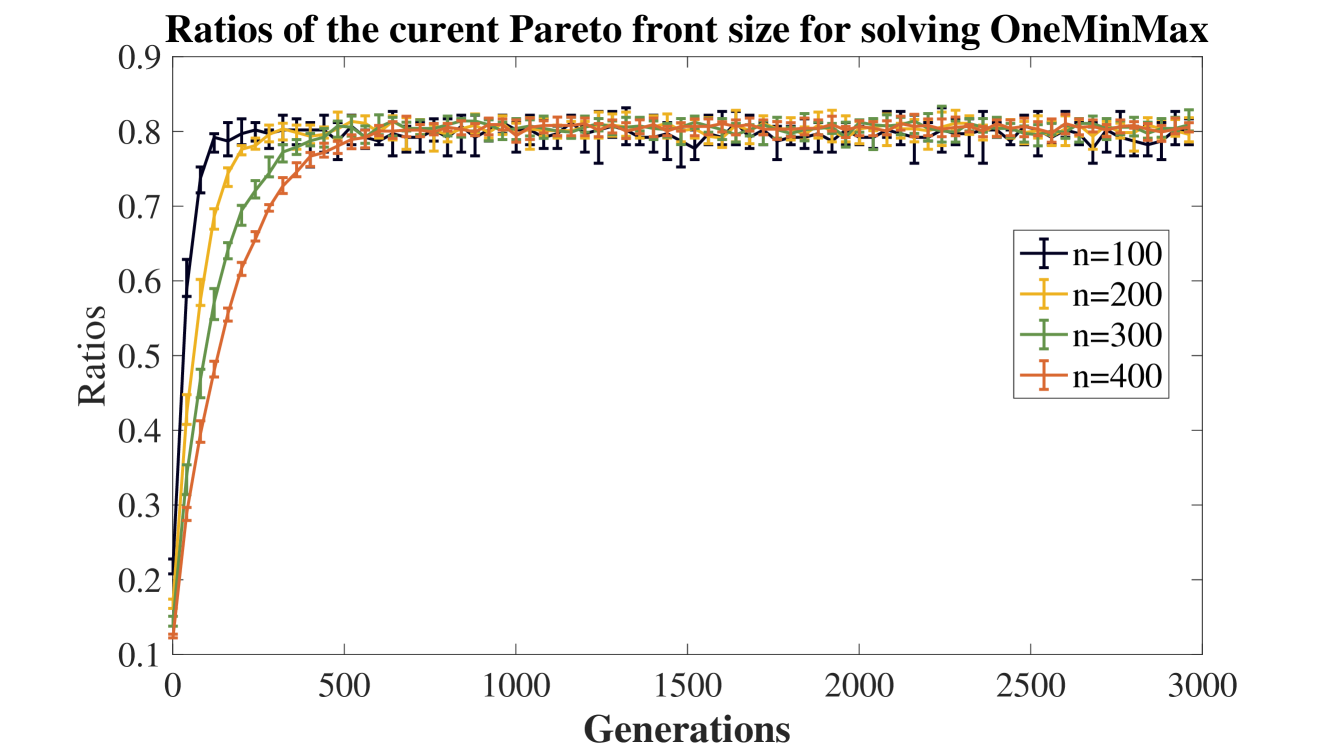
The chart illustrates the convergence behavior of Pareto front size ratios across different population sizes (n=100, 200, 300, 400) over 3000 generations. All lines exhibit rapid initial growth followed by stabilization near 0.8 ratio values.
### Components/Axes
- **X-axis (Generations)**: Linear scale from 0 to 3000 in increments of 500
- **Y-axis (Ratios)**: Logarithmic scale from 0.1 to 0.9 in increments of 0.1
- **Legend**: Positioned in top-right quadrant with four entries:
- Black squares: n=100
- Orange diamonds: n=200
- Green triangles: n=300
- Red crosses: n=400
- **Error bars**: Present on all data points, indicating measurement uncertainty
### Detailed Analysis
1. **n=100 (Black squares)**:
- Initial ratio: ~0.1 at 0 generations
- Rapid ascent to 0.8 by ~500 generations
- Plateau maintained with minor fluctuations (±0.02)
- Error bars: ~±0.01
2. **n=200 (Orange diamonds)**:
- Initial ratio: ~0.1 at 0 generations
- Slightly slower ascent (reaches 0.8 by ~750 generations)
- Stable plateau with similar error margins
3. **n=300 (Green triangles)**:
- Initial ratio: ~0.1 at 0 generations
- Gradual increase (reaches 0.8 by ~1000 generations)
- Consistent plateau with error bars matching other series
4. **n=400 (Red crosses)**:
- Initial ratio: ~0.1 at 0 generations
- Slowest ascent (reaches 0.8 by ~1250 generations)
- Maintains stable plateau with comparable error margins
### Key Observations
- All population sizes converge to similar final ratios (~0.8)
- Larger populations (n=400) require more generations to reach convergence
- Error margins remain consistently small (±0.01-0.02) across all series
- No significant outliers or anomalies detected
### Interpretation
The data demonstrates that while larger population sizes (n) require more generations to reach Pareto front convergence, they ultimately achieve similar stabilization ratios. This suggests:
1. **Population efficiency tradeoff**: Smaller populations converge faster but may require more generations for larger problems
2. **Algorithmic stability**: The plateau region indicates algorithmic stability once convergence is achieved
3. **Diminishing returns**: Increasing population size beyond a certain point (n=300-400) yields minimal improvements in final ratio
The consistent error margins across all series suggest reliable measurement methodology. The logarithmic y-axis emphasizes early-stage growth differences while compressing the plateau region, highlighting the algorithm's convergence characteristics.