## Heatmap Visualization: Directional Pattern Analysis
### Overview
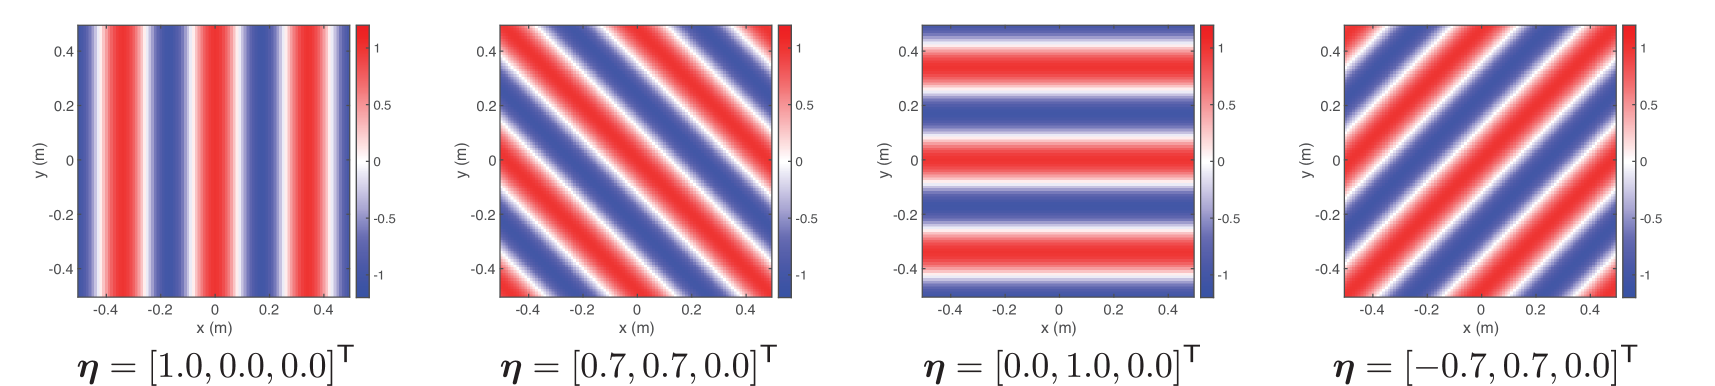
The image displays four heatmaps arranged horizontally, each representing a directional pattern influenced by a 3D vector η. The patterns transition from vertical/horizontal stripes to diagonal configurations, with color gradients ranging from blue (-1) to red (1). Each heatmap is labeled with a distinct η vector configuration.
### Components/Axes
- **X-axis**: Labeled "x (m)", spanning -0.4 to 0.4 meters.
- **Y-axis**: Labeled "y (m)", spanning -0.4 to 0.4 meters.
- **Color Bar**: Vertical gradient from blue (-1) to red (1), positioned on the right of each heatmap.
- **Labels**: Each heatmap includes a vector η = [a, b, c]^T, where a, b, c are scalar values.
### Detailed Analysis
1. **First Heatmap (η = [1.0, 0.0, 0.0]^T)**:
- **Pattern**: Vertical red/blue stripes aligned with the y-axis.
- **Color Distribution**: Alternating red (1) and blue (-1) bands along the x-axis.
- **Spatial Grounding**: Legend (color bar) matches stripe intensity; red corresponds to x = ±0.4, blue to x = ±0.2.
2. **Second Heatmap (η = [0.7, 0.7, 0.0]^T)**:
- **Pattern**: Diagonal stripes sloping from bottom-left to top-right.
- **Color Distribution**: Red (1) dominates upper-right regions; blue (-1) in lower-left.
- **Spatial Grounding**: Diagonal bands align with η's equal x/y components (0.7, 0.7).
3. **Third Heatmap (η = [0.0, 1.0, 0.0]^T)**:
- **Pattern**: Horizontal red/blue stripes aligned with the x-axis.
- **Color Distribution**: Red (1) at y = ±0.4; blue (-1) at y = ±0.2.
- **Spatial Grounding**: Horizontal bands reflect η's y-component dominance (1.0).
4. **Fourth Heatmap (η = [-0.7, 0.7, 0.0]^T)**:
- **Pattern**: Diagonal stripes sloping from top-left to bottom-right.
- **Color Distribution**: Red (1) in lower-right; blue (-1) in upper-left.
- **Spatial Grounding**: Negative x-component (-0.7) inverts the diagonal direction compared to the second heatmap.
### Key Observations
- **Directional Correlation**: η's components directly influence stripe orientation. Equal x/y magnitudes (e.g., 0.7, 0.7) produce 45° diagonal patterns.
- **Sign Sensitivity**: Negative x-components (e.g., -0.7) reverse diagonal slope direction.
- **Axis Alignment**: η components with zero values (e.g., [1.0, 0.0, 0.0]^T) produce axis-aligned patterns.
### Interpretation
The heatmaps visualize a directional field where η's components modulate spatial patterns. The first and third heatmaps demonstrate axis-aligned responses to single-axis dominance (x or y), while the second and fourth illustrate combined x/y influences. The color gradient (-1 to 1) quantifies the magnitude of the directional effect, with red/blue representing opposing polarities. This suggests a system where vector inputs (η) control spatial modulation, potentially modeling wave interference, stress distribution, or fluid dynamics. The consistent scaling across heatmaps implies a normalized response metric.