## Heatmap: Wave Patterns with Varying Parameters
### Overview
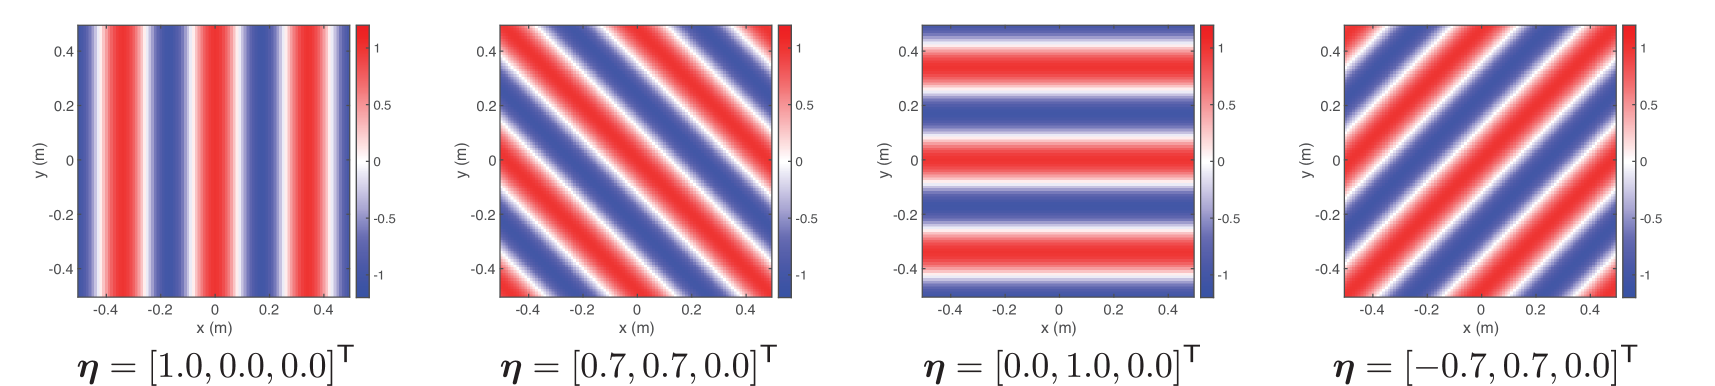
The image presents four heatmaps, each displaying a wave pattern. The x and y axes represent spatial dimensions in meters (m), ranging from approximately -0.45 to 0.45. The color gradient, ranging from blue to red, represents the wave amplitude, with blue indicating a value of -1 and red indicating a value of 1. Each heatmap is associated with a vector η, which likely represents parameters influencing the wave pattern.
### Components/Axes
* **X-axis:** x (m), ranging from -0.4 to 0.4
* **Y-axis:** y (m), ranging from -0.4 to 0.4
* **Colorbar:** Ranges from -1 (blue) to 1 (red), with 0.5 and 0 marked as intermediate values.
* **Parameter Vector:** Each heatmap is labeled with a vector η.
### Detailed Analysis
**Heatmap 1:**
* **Parameter Vector:** η = \[1.0, 0.0, 0.0]^T
* **Wave Pattern:** Vertical stripes alternating between red (positive amplitude) and blue (negative amplitude). The stripes are oriented parallel to the y-axis.
* **Observations:** The wave pattern is uniform across the y-axis. The wavelength appears consistent.
**Heatmap 2:**
* **Parameter Vector:** η = \[0.7, 0.7, 0.0]^T
* **Wave Pattern:** Diagonal stripes alternating between red and blue. The stripes are oriented at an angle relative to both the x and y axes.
* **Observations:** The wave pattern is uniform. The wavelength appears consistent.
**Heatmap 3:**
* **Parameter Vector:** η = \[0.0, 1.0, 0.0]^T
* **Wave Pattern:** Horizontal stripes alternating between red and blue. The stripes are oriented parallel to the x-axis.
* **Observations:** The wave pattern is uniform across the x-axis. The wavelength appears consistent.
**Heatmap 4:**
* **Parameter Vector:** η = \[-0.7, 0.7, 0.0]^T
* **Wave Pattern:** Diagonal stripes alternating between red and blue. The stripes are oriented at an angle, opposite to the angle in Heatmap 2.
* **Observations:** The wave pattern is uniform. The wavelength appears consistent.
### Key Observations
* The parameter vector η seems to control the orientation of the wave pattern.
* The first component of η appears to influence the x-axis orientation, while the second component influences the y-axis orientation.
* The third component of η is consistently 0.0 across all heatmaps.
### Interpretation
The heatmaps visualize wave patterns with varying orientations, controlled by the parameter vector η. The components of η likely represent weights or coefficients that determine the direction and possibly the frequency of the wave. The consistent value of 0.0 for the third component suggests it might be related to a parameter not visualized in these specific plots, such as amplitude or phase shift. The data suggests a relationship between the vector η and the angle of the wave propagation. A higher first component in η results in waves that are more vertically oriented, while a higher second component results in waves that are more horizontally oriented. The negative value in the first component of η in the fourth heatmap results in a wave pattern with an opposite diagonal orientation compared to the second heatmap.