\n
## Heatmaps: Parameter Variation Study
### Overview
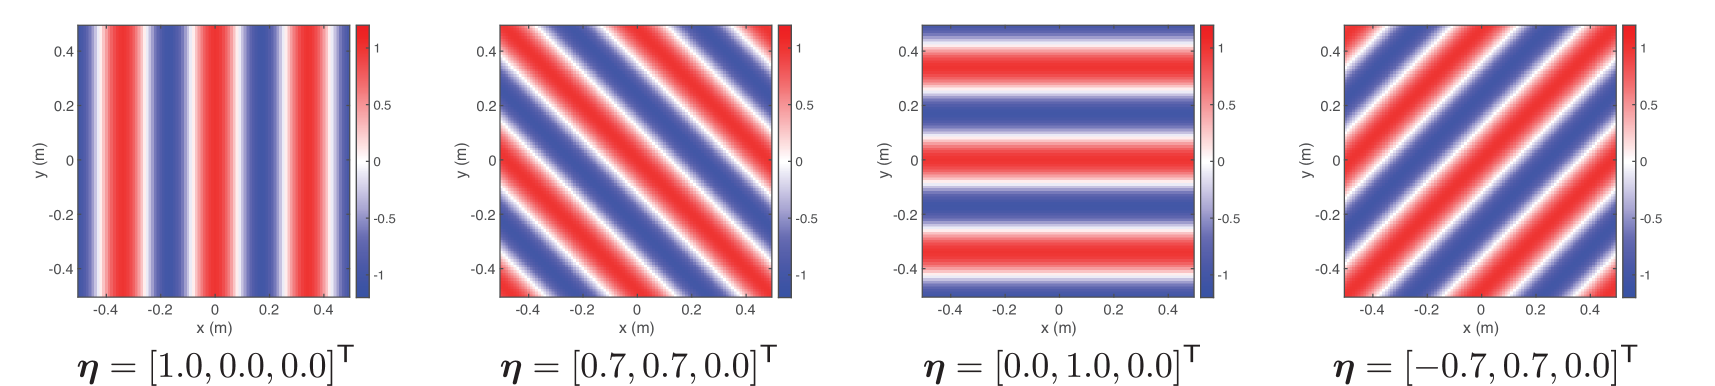
The image presents four heatmaps, arranged horizontally. Each heatmap visualizes a two-dimensional distribution, likely representing a function's value across a coordinate plane. The heatmaps appear to be illustrating the effect of varying a parameter vector 'η' on the distribution. The x and y axes are labeled in meters (m). Each heatmap is labeled with a specific value for the parameter vector η.
### Components/Axes
Each heatmap shares the following components:
* **X-axis:** Labeled "x (m)", ranging from approximately -0.4 to 0.4 meters.
* **Y-axis:** Labeled "y (m)", ranging from approximately -0.4 to 0.4 meters.
* **Color Scale:** A continuous color scale ranging from approximately -1 (blue) to 1 (red), with 0 represented by white. The scale is positioned to the right of each heatmap.
* **Parameter Label:** Below each heatmap, a label indicates the value of the parameter vector η.
### Detailed Analysis or Content Details
**Heatmap 1:** η = [1.0, 0.0, 0.0]<sup>T</sup>
The heatmap displays vertical stripes. The color transitions from red to blue and back to red as you move from left to right. The stripes are approximately 0.1 meters wide. The values appear to oscillate between approximately 1 and -1.
**Heatmap 2:** η = [0.7, 0.7, 0.0]<sup>T</sup>
This heatmap shows diagonal stripes, running from the bottom-left to the top-right. The color transitions along these diagonals, alternating between red and blue. The stripes are approximately 0.15 meters wide. The values oscillate between approximately 1 and -1.
**Heatmap 3:** η = [0.0, 1.0, 0.0]<sup>T</sup>
This heatmap displays horizontal stripes. The color transitions from red to blue and back to red as you move from top to bottom. The stripes are approximately 0.1 meters wide. The values appear to oscillate between approximately 1 and -1.
**Heatmap 4:** η = [-0.7, 0.7, 0.0]<sup>T</sup>
This heatmap shows diagonal stripes, running from the top-left to the bottom-right. The color transitions along these diagonals, alternating between red and blue. The stripes are approximately 0.15 meters wide. The values oscillate between approximately 1 and -1.
### Key Observations
* The parameter vector η significantly alters the orientation of the stripes in the heatmaps.
* When the first element of η is non-zero, the stripes are vertical.
* When the second element of η is non-zero, the stripes are horizontal.
* When the first and second elements of η are both non-zero, the stripes are diagonal.
* The magnitude of the elements in η appears to influence the width of the stripes.
* The color scale consistently represents values between -1 and 1 across all heatmaps.
### Interpretation
The data suggests that the parameter vector η controls the directionality of a periodic pattern. The heatmaps likely represent a solution to a partial differential equation or a wave phenomenon where the parameter η influences the wave's propagation direction. The different components of η seem to correspond to different spatial frequencies or wave vectors.
The consistent color scale indicates that the underlying function's range remains constant, while the parameter η modulates its spatial distribution. The change in stripe orientation with different η values suggests a linear relationship between the parameter components and the pattern's direction. The observed patterns could represent interference phenomena or the behavior of a system under varying external forces. The fact that the values oscillate between -1 and 1 suggests a normalized or bounded quantity, potentially a correlation coefficient or a normalized amplitude.