## Scatter Plot: Energy vs. Number of Satisfied Clauses
### Overview
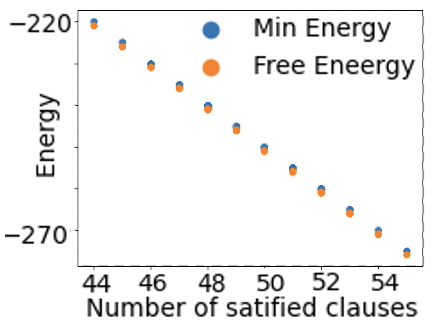
The image is a scatter plot comparing "Min Energy" and "Free Energy" against the "Number of satisfied clauses." Both energy types decrease as the number of satisfied clauses increases.
### Components/Axes
* **X-axis:** "Number of satified clauses" with markers at 44, 46, 48, 50, 52, and 54.
* **Y-axis:** "Energy" with markers at -220 and -270.
* **Legend (top-right):**
* Blue circle: "Min Energy"
* Orange circle: "Free Eneergy"
### Detailed Analysis
* **Min Energy (Blue):** The blue data points represent the "Min Energy." The trend is a downward slope.
* At 44 satisfied clauses, Min Energy is approximately -220.
* At 46 satisfied clauses, Min Energy is approximately -230.
* At 48 satisfied clauses, Min Energy is approximately -240.
* At 50 satisfied clauses, Min Energy is approximately -250.
* At 52 satisfied clauses, Min Energy is approximately -260.
* At 54 satisfied clauses, Min Energy is approximately -270.
* **Free Energy (Orange):** The orange data points represent the "Free Energy." The trend is a downward slope, closely following the "Min Energy" data.
* At 44 satisfied clauses, Free Energy is approximately -222.
* At 46 satisfied clauses, Free Energy is approximately -232.
* At 48 satisfied clauses, Free Energy is approximately -242.
* At 50 satisfied clauses, Free Energy is approximately -252.
* At 52 satisfied clauses, Free Energy is approximately -262.
* At 54 satisfied clauses, Free Energy is approximately -272.
### Key Observations
* Both "Min Energy" and "Free Energy" decrease linearly as the "Number of satisfied clauses" increases.
* The "Free Energy" is consistently slightly lower (more negative) than the "Min Energy" for each corresponding number of satisfied clauses.
* The data points are tightly clustered, indicating a strong correlation between the number of satisfied clauses and both energy types.
### Interpretation
The plot suggests that increasing the number of satisfied clauses in a system leads to a decrease in both the minimum energy and free energy. The close proximity of the "Min Energy" and "Free Energy" data points indicates that the system's free energy is strongly influenced by its minimum energy state. The linear trend suggests a direct relationship between the number of satisfied clauses and the energy levels. This could imply that satisfying more clauses stabilizes the system, resulting in lower energy states.