## Scatter Plot: Energy vs. Number of Satisfied Clauses
### Overview
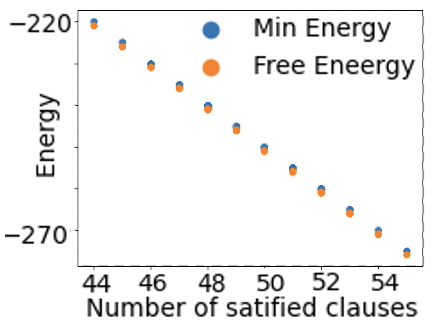
The image is a scatter plot comparing two energy metrics ("Min Energy" and "Free Energy") across a range of satisfied clauses (44–54). Both metrics show a downward trend in energy as the number of satisfied clauses increases. Data points are color-coded (blue for Min Energy, orange for Free Energy) and closely aligned, with Min Energy consistently slightly higher than Free Energy.
### Components/Axes
- **X-axis**: "Number of satisfied clauses" (integer values: 44, 46, 48, 50, 52, 54).
- **Y-axis**: "Energy" (continuous scale from -270 to -220).
- **Legend**: Located in the top-right corner, with blue representing "Min Energy" and orange representing "Free Energy."
- **Data Points**: Blue dots (Min Energy) and orange dots (Free Energy) plotted at each x-axis value.
### Detailed Analysis
- **Min Energy (Blue)**:
- At 44 clauses: ~-220
- At 46 clauses: ~-221
- At 48 clauses: ~-223
- At 50 clauses: ~-225
- At 52 clauses: ~-227
- At 54 clauses: ~-229
- **Free Energy (Orange)**:
- At 44 clauses: ~-221
- At 46 clauses: ~-222
- At 48 clauses: ~-224
- At 50 clauses: ~-226
- At 52 clauses: ~-228
- At 54 clauses: ~-230
Both series exhibit a linear downward trend, with Min Energy consistently ~1 unit higher than Free Energy at each clause count. The energy difference narrows slightly as clauses increase (e.g., from ~1 unit at 44 clauses to ~1 unit at 54 clauses).
### Key Observations
1. **Consistent Trend**: Both metrics decrease monotonically as clauses increase.
2. **Energy Gap**: Min Energy remains marginally higher than Free Energy across all clause counts.
3. **Data Precision**: Points are tightly clustered, suggesting minimal variability in measurements.
### Interpretation
The plot demonstrates that satisfying more clauses correlates with lower energy states for both Min Energy and Free Energy. The near-identical trajectories imply that the system’s energy landscape is relatively stable, with Min Energy serving as a slight upper bound for Free Energy. The small energy gap (~1 unit) suggests that the two metrics are closely related, possibly reflecting different theoretical or computational approaches to energy calculation. The linear relationship indicates a predictable trade-off between clause satisfaction and energy minimization, which could inform optimization strategies in systems like SAT solvers or thermodynamic models.