## Line Graph: Accuracy vs. Average Exit Round
### Overview
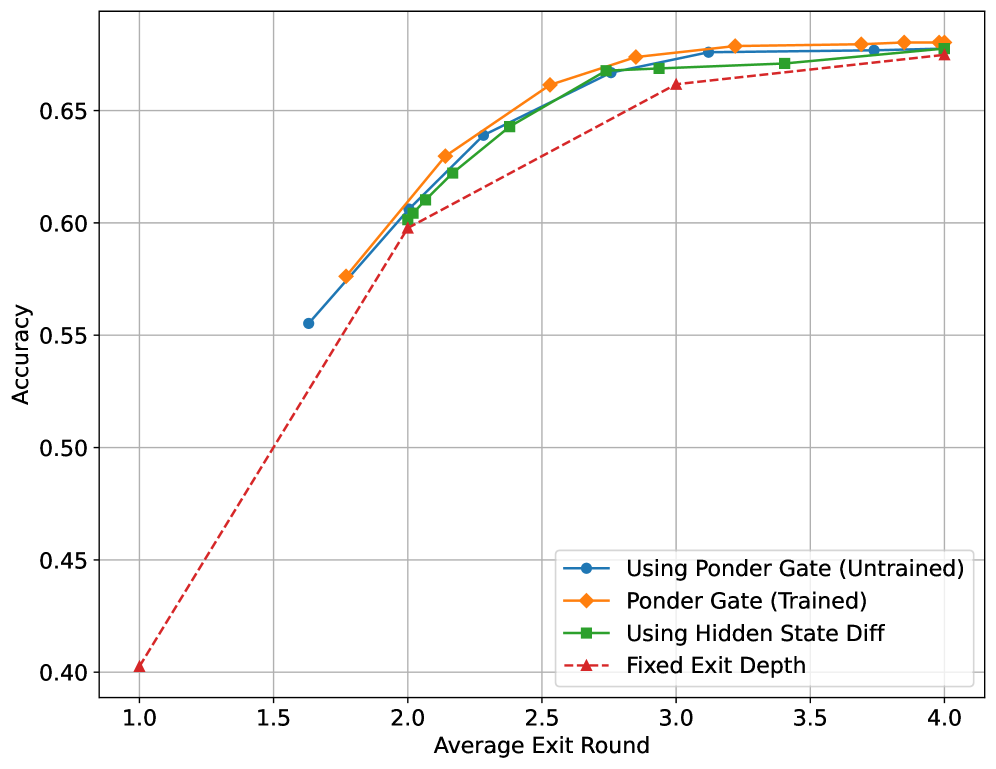
The image is a line graph comparing the accuracy of four different methods across varying average exit rounds (1.0 to 4.0). The y-axis represents accuracy (0.40 to 0.65), while the x-axis represents average exit rounds. Four data series are plotted with distinct line styles and colors, as indicated in the legend located in the bottom-right corner.
### Components/Axes
- **X-axis (Horizontal)**: Labeled "Average Exit Round," with markers at 1.0, 2.0, 3.0, and 4.0.
- **Y-axis (Vertical)**: Labeled "Accuracy," with increments of 0.05 from 0.40 to 0.65.
- **Legend**: Positioned in the bottom-right corner, mapping:
- Blue solid line with circles: "Using Ponder Gate (Untrained)"
- Orange solid line with diamonds: "Ponder Gate (Trained)"
- Green solid line with squares: "Using Hidden State Diff"
- Red dashed line with triangles: "Fixed Exit Depth"
### Detailed Analysis
1. **Using Ponder Gate (Untrained)** (Blue):
- Starts at (1.0, 0.55) and increases steadily.
- Data points: (2.0, 0.60), (3.0, 0.65), (4.0, 0.68).
- Trend: Consistent upward slope.
2. **Ponder Gate (Trained)** (Orange):
- Starts at (1.0, 0.40) and rises sharply.
- Data points: (2.0, 0.60), (3.0, 0.65), (4.0, 0.68).
- Trend: Steeper ascent than other lines, surpassing all others by x=4.0.
3. **Using Hidden State Diff** (Green):
- Starts at (1.0, 0.50) and increases gradually.
- Data points: (2.0, 0.60), (3.0, 0.65), (4.0, 0.67).
- Trend: Slightly slower growth compared to blue and orange lines.
4. **Fixed Exit Depth** (Red dashed):
- Starts at (1.0, 0.40) and rises steadily.
- Data points: (2.0, 0.55), (3.0, 0.60), (4.0, 0.65).
- Trend: Linear increase but remains below all other methods.
### Key Observations
- The **Ponder Gate (Trained)** method (orange) demonstrates the highest accuracy by x=4.0, outperforming all other methods.
- The **Using Ponder Gate (Untrained)** (blue) and **Using Hidden State Diff** (green) lines converge closely, with blue slightly ahead at x=4.0.
- **Fixed Exit Depth** (red dashed) lags behind all other methods throughout the range.
- All methods show improvement as average exit rounds increase, but the rate of improvement varies significantly.
### Interpretation
The data suggests that **training the Ponder Gate method** (orange line) yields the most significant performance gains over time, particularly in later exit rounds. The **Using Ponder Gate (Untrained)** and **Using Hidden State Diff** methods exhibit similar trajectories, indicating that hidden state differences may not provide a substantial advantage over untrained Ponder Gate approaches. In contrast, **Fixed Exit Depth** (red dashed) underperforms consistently, implying that dynamic exit strategies (e.g., Ponder Gate) are more effective than static depth-based approaches. The sharp rise of the trained Ponder Gate method highlights the importance of training in optimizing accuracy for this task.