## Line Chart: Accuracy vs. Average Exit Round
### Overview
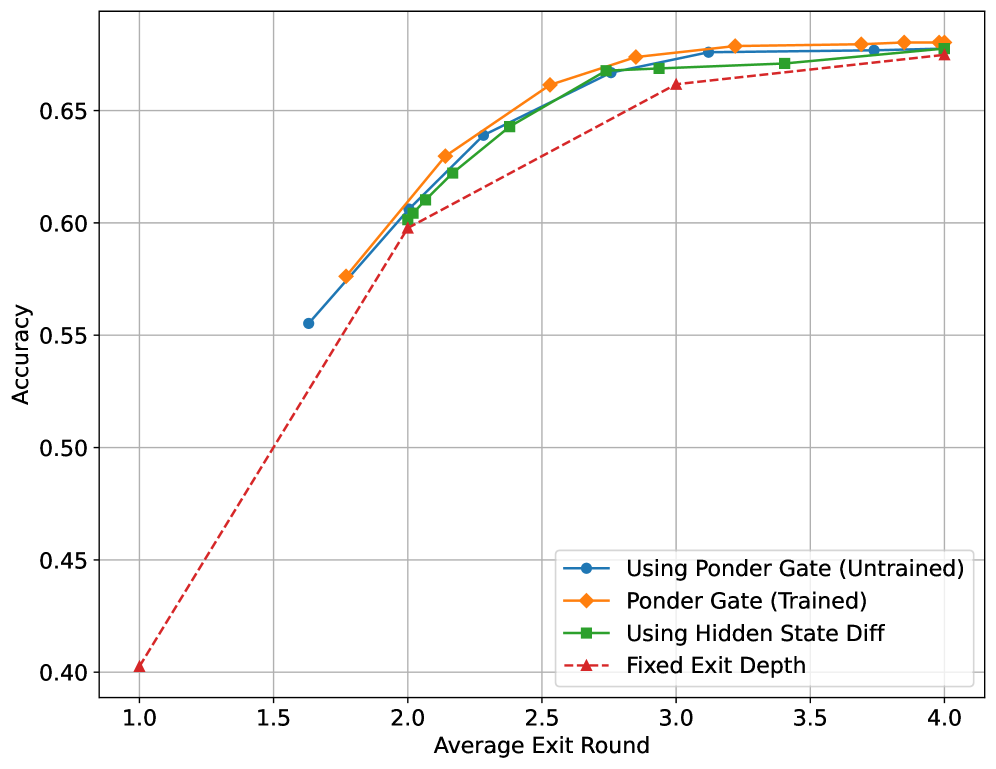
The image is a line chart comparing the accuracy of different methods (Using Ponder Gate (Untrained), Ponder Gate (Trained), Using Hidden State Diff, and Fixed Exit Depth) against the average exit round. The x-axis represents the average exit round, ranging from 1.0 to 4.0. The y-axis represents accuracy, ranging from 0.40 to 0.65.
### Components/Axes
* **X-axis:** Average Exit Round, ranging from 1.0 to 4.0 in increments of 0.5.
* **Y-axis:** Accuracy, ranging from 0.40 to 0.65 in increments of 0.05.
* **Legend (bottom-left):**
* Blue line with circle markers: Using Ponder Gate (Untrained)
* Orange line with diamond markers: Ponder Gate (Trained)
* Green line with square markers: Using Hidden State Diff
* Red dashed line with triangle markers: Fixed Exit Depth
### Detailed Analysis
* **Using Ponder Gate (Untrained) (Blue Line):**
* Trend: Generally increasing, plateaus after x=3.0
* Data Points:
* (1.6, 0.556)
* (2.0, 0.605)
* (2.5, 0.645)
* (3.0, 0.665)
* (3.5, 0.668)
* (4.0, 0.670)
* **Ponder Gate (Trained) (Orange Line):**
* Trend: Generally increasing, plateaus after x=3.0
* Data Points:
* (1.8, 0.578)
* (2.0, 0.608)
* (2.5, 0.648)
* (3.0, 0.675)
* (3.5, 0.675)
* (4.0, 0.672)
* **Using Hidden State Diff (Green Line):**
* Trend: Generally increasing, plateaus after x=3.0
* Data Points:
* (2.0, 0.600)
* (2.5, 0.640)
* (3.0, 0.668)
* (3.5, 0.670)
* (4.0, 0.670)
* **Fixed Exit Depth (Red Dashed Line):**
* Trend: Linearly increasing
* Data Points:
* (1.0, 0.402)
* (2.0, 0.600)
* (3.0, 0.670)
* (4.0, 0.675)
### Key Observations
* The "Ponder Gate (Trained)" method (orange line) generally achieves the highest accuracy across all average exit rounds, closely followed by "Using Hidden State Diff" (green line).
* The "Fixed Exit Depth" method (red dashed line) starts with the lowest accuracy but increases linearly, eventually reaching similar accuracy levels as other methods at higher average exit rounds.
* All methods except "Fixed Exit Depth" show a plateau in accuracy after an average exit round of approximately 3.0.
### Interpretation
The chart demonstrates the relationship between the average exit round and the accuracy of different methods. The "Ponder Gate (Trained)" method appears to be the most effective, achieving the highest accuracy overall. The "Fixed Exit Depth" method, while starting with lower accuracy, shows a consistent improvement with increasing average exit rounds, suggesting that it benefits from deeper processing. The plateau observed in the other methods suggests that there may be a point of diminishing returns in increasing the average exit round beyond 3.0. The data suggests that adaptive methods like Ponder Gate and Hidden State Diff initially outperform fixed depth methods, but with sufficient depth, the fixed depth method can achieve comparable performance.