# Technical Document Extraction: Receiver Operating Characteristic Curve (Training)
## Image Description
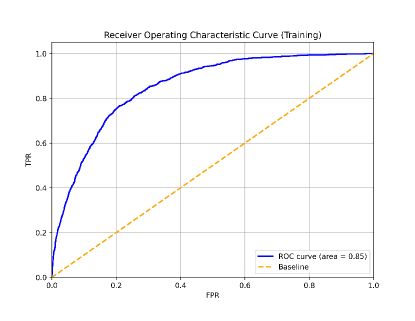
The image is a **Receiver Operating Characteristic (ROC) curve** chart titled **"Receiver Operating Characteristic Curve (Training)"**. It visualizes the performance of a classification model during training, comparing the **True Positive Rate (TPR)** against the **False Positive Rate (FPR)**. The chart includes two data series: a solid blue line representing the ROC curve and a dashed orange line representing a baseline. The background is white with a light gray grid.
---
## Key Components and Labels
### Axis Titles
- **X-axis**: Labeled **"FPR"** (False Positive Rate), ranging from **0.0** to **1.0**.
- **Y-axis**: Labeled **"TPR"** (True Positive Rate), ranging from **0.0** to **1.0**.
### Legend
- **Location**: Bottom-right corner of the chart.
- **Entries**:
- **Blue solid line**: **"ROC curve (area = 0.85)"**.
- **Orange dashed line**: **"Baseline"**.
### Axis Markers
- Grid lines are **light gray**, with numerical markers at **0.0, 0.2, 0.4, 0.6, 0.8, 1.0** for both axes.
---
## Chart Analysis
### Data Series
1. **ROC Curve (Blue Solid Line)**:
- **Trend**: Starts at **(0.0, 0.0)**, rises steeply, then flattens as it approaches **(1.0, 1.0)**. The curve indicates a high-performance model, with the area under the curve (AUC) explicitly stated as **0.85**.
- **Key Points**:
- At **FPR = 0.0**, **TPR = 0.0**.
- At **FPR = 0.2**, **TPR ≈ 0.7**.
- At **FPR = 0.4**, **TPR ≈ 0.85**.
- At **FPR = 0.6**, **TPR ≈ 0.95**.
- At **FPR = 0.8**, **TPR ≈ 0.98**.
- At **FPR = 1.0**, **TPR = 1.0**.
2. **Baseline (Orange Dashed Line)**:
- **Trend**: A straight diagonal line from **(0.0, 0.0)** to **(1.0, 1.0)**, representing a random classifier with **AUC = 0.5**.
---
## Spatial Grounding and Color Verification
- **Legend Position**: Bottom-right corner (confirmed).
- **Color Matching**:
- **Blue solid line** corresponds to the **"ROC curve"** label.
- **Orange dashed line** corresponds to the **"Baseline"** label.
---
## Trend Verification
- **ROC Curve**: Slopes upward, indicating increasing TPR with rising FPR. The curve's concavity suggests a model that effectively distinguishes between classes.
- **Baseline**: Linear trend, representing the expected performance of a random classifier.
---
## Component Isolation
1. **Header**: Title **"Receiver Operating Characteristic Curve (Training)"**.
2. **Main Chart**:
- Axes labeled **FPR** (x-axis) and **TPR** (y-axis).
- Grid lines and numerical markers for clarity.
3. **Footer**: Legend with two entries (ROC curve and Baseline).
---
## Textual Information Extracted
- **Title**: "Receiver Operating Characteristic Curve (Training)".
- **Axis Labels**: "FPR" (x-axis), "TPR" (y-axis).
- **Legend Entries**:
- "ROC curve (area = 0.85)" (blue solid line).
- "Baseline" (orange dashed line).
- **Area Under ROC Curve**: 0.85 (AUC).
---
## Conclusion
The chart demonstrates a high-performing classification model with an AUC of **0.85**, significantly outperforming the baseline (AUC = 0.5). The ROC curve's upward trend and flattening behavior indicate strong discriminative power, while the baseline serves as a reference for random performance. All textual and visual elements are consistent with standard ROC curve conventions.