## Bar and Line Chart: Truth Count vs. Layer Index for llama3 + causal intervention
### Overview
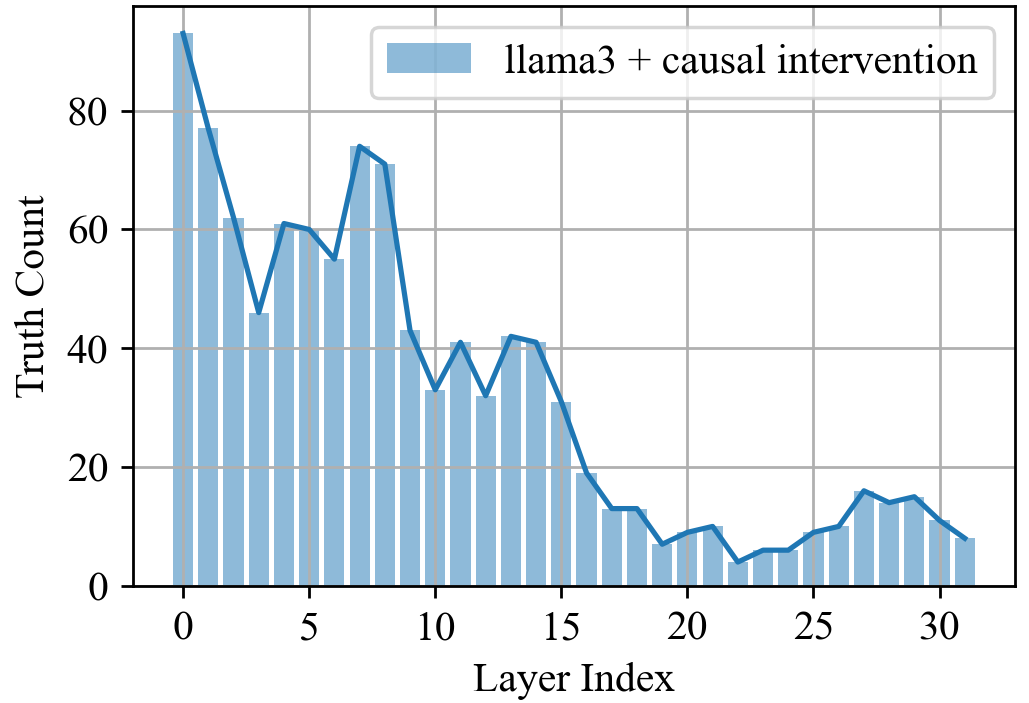
The image is a combination of a bar chart and a line graph, displaying the "Truth Count" on the y-axis against the "Layer Index" on the x-axis. The data represents "llama3 + causal intervention". The bar chart shows the distribution of truth counts across different layers, while the line graph highlights the trend of truth counts across these layers.
### Components/Axes
* **X-axis:** "Layer Index", ranging from 0 to 30 in increments of 5.
* **Y-axis:** "Truth Count", ranging from 0 to 80 in increments of 20.
* **Legend:** Located in the top-right corner, labeled "llama3 + causal intervention" and represented by a light blue color. This corresponds to both the bars and the line.
* **Data Series:** "llama3 + causal intervention" is represented by both light blue bars and a dark blue line.
### Detailed Analysis
**Bar Chart Analysis:**
* The bars represent the count of "Truth" at each "Layer Index".
* The bars are light blue, matching the legend.
* The bars are positioned at each integer value of the Layer Index from 0 to 31.
**Line Graph Analysis:**
* The line graph represents the trend of "Truth Count" across different "Layer Index" values.
* The line is dark blue, matching the legend.
* The line connects the tops of the bars, showing the overall trend.
**Data Points and Trends:**
* **Layer Index 0:** Truth Count is approximately 75.
* **Layer Index 1:** Truth Count is approximately 85.
* **Layer Index 2:** Truth Count is approximately 60.
* **Layer Index 3:** Truth Count is approximately 60.
* **Layer Index 4:** Truth Count is approximately 58.
* **Layer Index 5:** Truth Count is approximately 60.
* **Layer Index 6:** Truth Count is approximately 55.
* **Layer Index 7:** Truth Count is approximately 73.
* **Layer Index 8:** Truth Count is approximately 70.
* **Layer Index 9:** Truth Count is approximately 42.
* **Layer Index 10:** Truth Count is approximately 32.
* **Layer Index 11:** Truth Count is approximately 38.
* **Layer Index 12:** Truth Count is approximately 40.
* **Layer Index 13:** Truth Count is approximately 38.
* **Layer Index 14:** Truth Count is approximately 40.
* **Layer Index 15:** Truth Count is approximately 30.
* **Layer Index 16:** Truth Count is approximately 18.
* **Layer Index 17:** Truth Count is approximately 14.
* **Layer Index 18:** Truth Count is approximately 12.
* **Layer Index 19:** Truth Count is approximately 10.
* **Layer Index 20:** Truth Count is approximately 8.
* **Layer Index 21:** Truth Count is approximately 6.
* **Layer Index 22:** Truth Count is approximately 8.
* **Layer Index 23:** Truth Count is approximately 6.
* **Layer Index 24:** Truth Count is approximately 8.
* **Layer Index 25:** Truth Count is approximately 10.
* **Layer Index 26:** Truth Count is approximately 12.
* **Layer Index 27:** Truth Count is approximately 14.
* **Layer Index 28:** Truth Count is approximately 16.
* **Layer Index 29:** Truth Count is approximately 14.
* **Layer Index 30:** Truth Count is approximately 10.
* **Layer Index 31:** Truth Count is approximately 8.
**Trend:** The "Truth Count" generally decreases as the "Layer Index" increases, with a significant drop between Layer Index 7 and 10. After Layer Index 20, the "Truth Count" stabilizes at a low level.
### Key Observations
* The highest "Truth Count" occurs at Layer Index 1, with a value of approximately 85.
* There is a significant drop in "Truth Count" between Layer Index 7 and 10.
* The "Truth Count" stabilizes at a low level after Layer Index 20.
### Interpretation
The chart illustrates how the "Truth Count" changes across different layers in the "llama3" model after a "causal intervention". The initial high "Truth Count" at lower layer indices suggests that these layers are more sensitive to the intervention. The subsequent decrease indicates that the effect of the intervention diminishes as the layer index increases. The stabilization at a low "Truth Count" in the higher layers suggests that these layers are less affected by the intervention. This information can be valuable for understanding the model's behavior and the impact of causal interventions on its different layers.