## Bar Chart with Line Overlay: Truth Count Distribution Across Layer Indices
### Overview
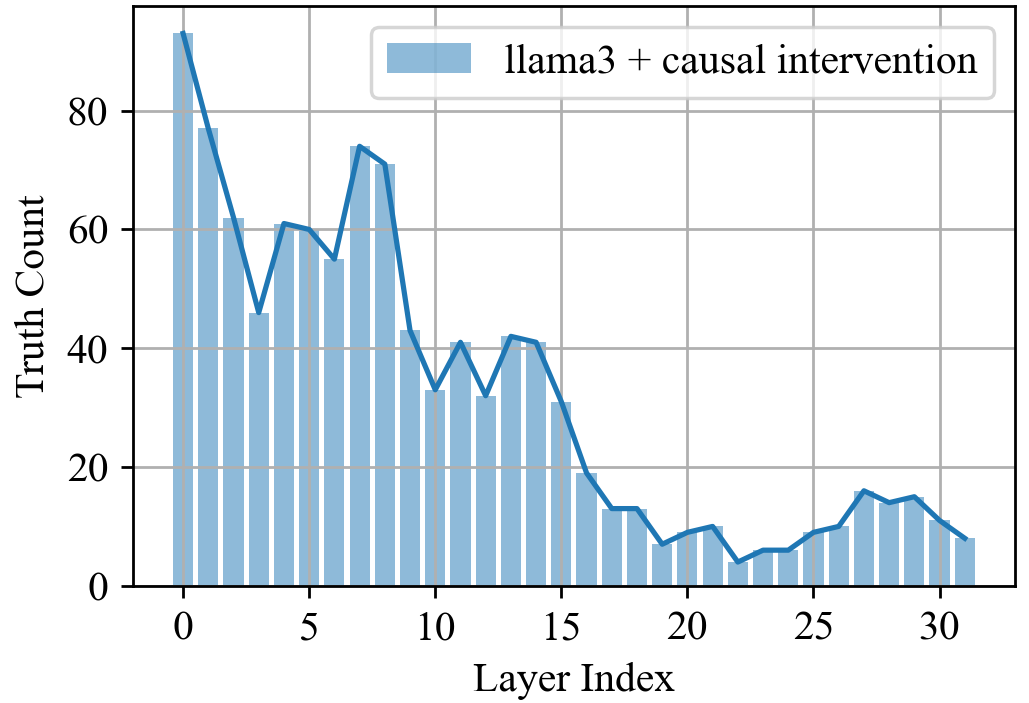
The image displays a bar chart with a superimposed line graph, illustrating the relationship between "Layer Index" (x-axis) and "Truth Count" (y-axis). The chart is labeled "llama3 + causal intervention" in the legend, with blue bars and a blue line. The data shows a bimodal distribution with sharp declines after specific layer indices.
### Components/Axes
- **X-axis (Layer Index)**: Numerical scale from 0 to 30, labeled "Layer Index."
- **Y-axis (Truth Count)**: Numerical scale from 0 to 100, labeled "Truth Count."
- **Legend**: Positioned in the top-right corner, labeled "llama3 + causal intervention" with a blue fill.
- **Bars**: Blue vertical bars representing truth counts for each layer index.
- **Line Graph**: Blue line overlaying the bars, tracing the trend of truth counts.
### Detailed Analysis
- **Layer 0**: Tallest bar (~90 truth count), with the line peaking at the same value.
- **Layer 7**: Second-tallest bar (~70 truth count), with the line peaking here as well.
- **Layer 10–15**: Bars and line show moderate values (~40–60), with minor fluctuations.
- **Layer 16–20**: Sharp decline to ~10–20 truth counts, with the line dropping steeply.
- **Layer 21–30**: Bars and line stabilize at low values (~5–15), with slight fluctuations.
### Key Observations
1. **Bimodal Distribution**: Peaks at Layer 0 and Layer 7, followed by a sharp decline.
2. **Line-Bar Alignment**: The line graph closely follows the bar heights, suggesting it represents a smoothed or aggregated version of the bar data.
3. **Post-Layer 7 Decline**: Both bars and line drop sharply after Layer 7, with minimal recovery afterward.
4. **Late-Layer Fluctuations**: Minor increases in Layers 27–29 (~15 truth count) but no sustained recovery.
### Interpretation
The data suggests that the "llama3 + causal intervention" has a strong initial impact in the first two layers (0 and 7), after which its effectiveness diminishes significantly. The bimodal peak may indicate an optimal intervention point at Layer 7, followed by diminishing returns or potential negative effects in subsequent layers. The late-layer fluctuations could reflect residual effects or noise in the data. The alignment of the line and bars implies consistency in the measured truth counts across the dataset.