## 2x2 Grid of Plots: Leader-Follower Multi-Agent System Analysis
### Overview
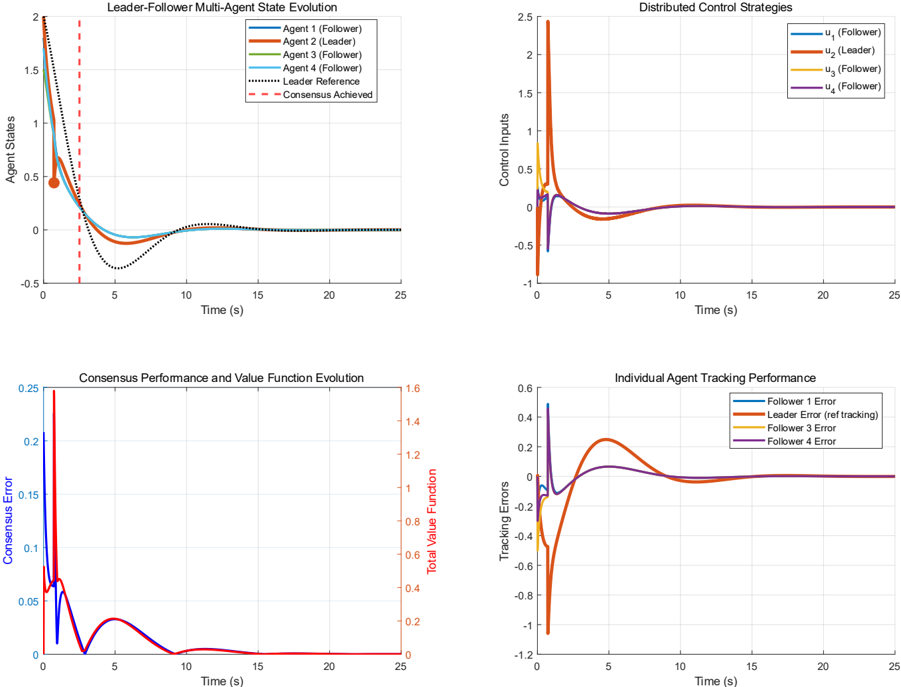
The image contains four subplots analyzing a leader-follower multi-agent system. Each plot visualizes different aspects: state evolution, control strategies, consensus performance, and tracking errors. All plots share a time axis (0–25 seconds) and use distinct color-coded data series.
---
### Components/Axes
#### Top-Left: Leader-Follower Multi-Agent State Evolution
- **X-axis**: Time (s) [0, 5, 10, 15, 20, 25]
- **Y-axis**: Agent States [-0.5, 0, 0.5, 1, 1.5, 2]
- **Legend**:
- Blue: Agent 1 (Follower)
- Orange: Agent 2 (Leader)
- Green: Agent 3 (Follower)
- Light Blue: Agent 4 (Follower)
- Dotted Black: Leader Reference
- Red Dashed: Consensus Achieved
- **Key Elements**: Red dashed vertical line at ~5s (consensus time).
#### Top-Right: Distributed Control Strategies
- **X-axis**: Time (s) [0, 5, 10, 15, 20, 25]
- **Y-axis**: Control Inputs [-1, -0.5, 0, 0.5, 1, 1.5, 2.5]
- **Legend**:
- Blue: u₁ (Follower)
- Orange: u₂ (Leader)
- Yellow: u₃ (Follower)
- Purple: u₄ (Follower)
#### Bottom-Left: Consensus Performance and Value Function Evolution
- **X-axis**: Time (s) [0, 5, 10, 15, 20, 25]
- **Y-axis**:
- Left: Consensus Error [0, 0.05, 0.1, 0.15, 0.2, 0.25]
- Right: Total Value Function [0, 0.2, 0.4, 0.6, 0.8, 1.2, 1.4, 1.6]
- **Legend**:
- Red: Consensus Error
- Orange: Total Value Function
#### Bottom-Right: Individual Agent Tracking Performance
- **X-axis**: Time (s) [0, 5, 10, 15, 20, 25]
- **Y-axis**: Tracking Errors [-1.2, -0.8, -0.6, -0.4, -0.2, 0, 0.2, 0.4, 0.6]
- **Legend**:
- Blue: Follower 1 Error
- Orange: Leader Error (ref tracking)
- Yellow: Follower 3 Error
- Purple: Follower 4 Error
---
### Detailed Analysis
#### Top-Left: State Evolution
- **Trend**: All agent states (blue, orange, green, light blue) converge to the dotted black leader reference line after ~5s. Initial divergence occurs between 0–5s.
- **Key Data Points**:
- Agent 2 (Leader, orange) starts at ~1.8 and stabilizes at ~0.1.
- Consensus achieved at ~5s (red dashed line).
#### Top-Right: Control Strategies
- **Trend**: Leader control input (orange) spikes sharply to ~2.5 at t=0, then decays to ~0.1. Followers (blue, yellow, purple) show smaller, delayed spikes.
- **Key Data Points**:
- Leader (u₂) peaks at ~2.5 at t=0.
- Followers stabilize near 0 after ~10s.
#### Bottom-Left: Consensus and Value Function
- **Trend**: Consensus error (red) drops from ~0.25 to near 0 by t=5s. Total value function (orange) starts at ~1.6, drops to ~0.2 by t=5s, then stabilizes.
- **Key Data Points**:
- Consensus error: 0.25 → 0.05 (t=0→5s).
- Value function: 1.6 → 0.2 (t=0→5s).
#### Bottom-Right: Tracking Performance
- **Trend**: All agents (blue, orange, yellow, purple) show initial high errors (~1.2) that decay to near 0 by t=10s. Leader (orange) stabilizes fastest.
- **Key Data Points**:
- Leader error: ~1.2 → 0 (t=0→10s).
- Followers stabilize within ±0.1 after t=10s.
---
### Key Observations
1. **Consensus Timing**: All agents align with the leader reference within ~5s (top-left plot).
2. **Control Input Dynamics**: Leader’s control input dominates initially (top-right plot), suggesting centralized decision-making.
3. **Value Function Convergence**: Rapid decline in value function (bottom-left) indicates efficient consensus achievement.
4. **Tracking Error Reduction**: All agents reduce tracking errors by ~90% within 10s (bottom-right plot).
---
### Interpretation
The system demonstrates rapid consensus (5s) and stable tracking performance. The leader’s control input dominates early dynamics, while followers converge autonomously. The value function’s sharp decline suggests the system prioritizes consensus over individual objectives. No outliers observed; all agents exhibit similar convergence patterns. This aligns with centralized-decentralized hybrid control strategies, where the leader guides initial alignment, and followers maintain stability.