## Chart: Leader-Follower Multi-Agent System Performance
### Overview
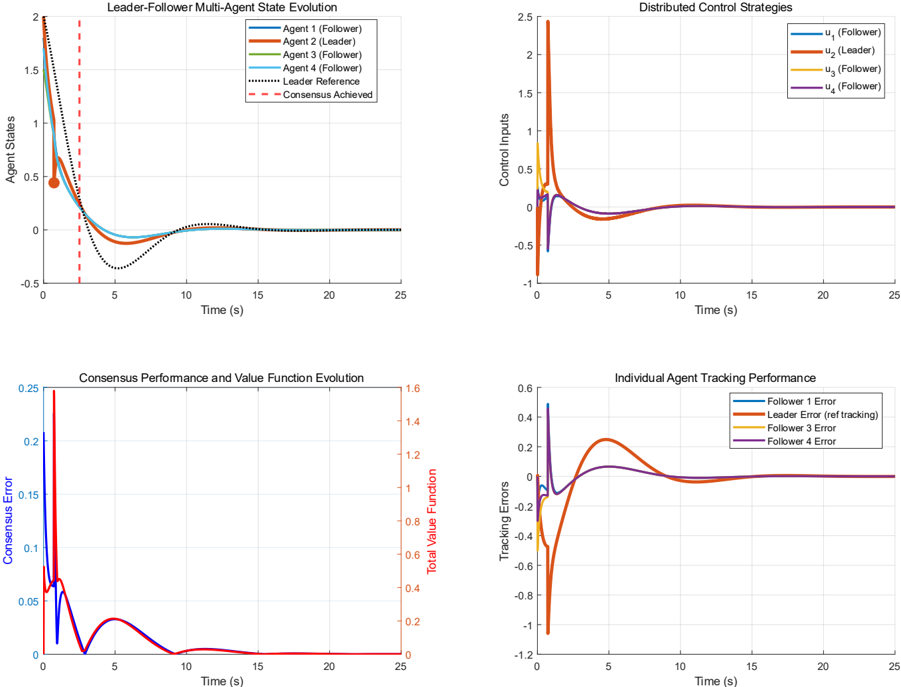
The image presents four plots illustrating the performance of a leader-follower multi-agent system. The plots show agent state evolution, distributed control strategies, consensus performance, and individual agent tracking performance over time.
### Components/Axes
**Top-Left Plot: Leader-Follower Multi-Agent State Evolution**
* **Title:** Leader-Follower Multi-Agent State Evolution
* **Y-axis:** Agent States
* Scale: -0.5 to 2.0, incrementing by 0.5
* **X-axis:** Time (s)
* Scale: 0 to 25, incrementing by 5
* **Legend (Top-Right):**
* Agent 1 (Follower) - Blue
* Agent 2 (Leader) - Orange
* Agent 3 (Follower) - Yellow
* Agent 4 (Follower) - Light Blue
* Leader Reference - Black dotted line
* Consensus Achieved - Red dashed line
**Top-Right Plot: Distributed Control Strategies**
* **Title:** Distributed Control Strategies
* **Y-axis:** Control Inputs
* Scale: -1 to 2.5, incrementing by 0.5
* **X-axis:** Time (s)
* Scale: 0 to 25, incrementing by 5
* **Legend (Top-Right):**
* u1 (Follower) - Blue
* u2 (Leader) - Orange
* u3 (Follower) - Yellow
* u4 (Follower) - Purple
**Bottom-Left Plot: Consensus Performance and Value Function Evolution**
* **Title:** Consensus Performance and Value Function Evolution
* **Left Y-axis:** Consensus Error
* Scale: 0 to 0.25, incrementing by 0.05
* **Right Y-axis:** Total Value Function
* Scale: 0 to 1.6, incrementing by 0.2
* **X-axis:** Time (s)
* Scale: 0 to 25, incrementing by 5
* Consensus Error - Blue
* Total Value Function - Red
**Bottom-Right Plot: Individual Agent Tracking Performance**
* **Title:** Individual Agent Tracking Performance
* **Y-axis:** Tracking Errors
* Scale: -1.2 to 0.6, incrementing by 0.2
* **X-axis:** Time (s)
* Scale: 0 to 25, incrementing by 5
* **Legend (Top-Right):**
* Follower 1 Error - Blue
* Leader Error (ref tracking) - Orange
* Follower 3 Error - Yellow
* Follower 4 Error - Purple
### Detailed Analysis
**Top-Left Plot: Leader-Follower Multi-Agent State Evolution**
* **Agent 1 (Follower) - Blue:** Starts at approximately 2, rapidly decreases to around 0 at t=5, then converges to 0.
* **Agent 2 (Leader) - Orange:** Starts at approximately 0.5, decreases to around -0.1 at t=5, then converges to 0.
* **Agent 3 (Follower) - Yellow:** Starts at approximately 2, rapidly decreases to around 0 at t=5, then converges to 0.
* **Agent 4 (Follower) - Light Blue:** Starts at approximately 2, rapidly decreases to around 0 at t=5, then converges to 0.
* **Leader Reference - Black dotted line:** Starts at approximately 0.5, decreases to around 0 at t=5, then remains at 0.
* **Consensus Achieved - Red dashed line:** Vertical line at approximately t=2.5.
**Top-Right Plot: Distributed Control Strategies**
* **u1 (Follower) - Blue:** Starts at approximately -1, increases rapidly to around 0.5, then converges to 0.
* **u2 (Leader) - Orange:** Starts at approximately 2.5, decreases rapidly to around 0, then converges to 0.
* **u3 (Follower) - Yellow:** Starts at approximately 0.5, decreases rapidly to around 0, then converges to 0.
* **u4 (Follower) - Purple:** Starts at approximately -0.5, increases rapidly to around 0, then converges to 0.
**Bottom-Left Plot: Consensus Performance and Value Function Evolution**
* **Consensus Error - Blue:** Starts at approximately 0.25, decreases rapidly to around 0 at t=5, then remains at 0.
* **Total Value Function - Red:** Starts at approximately 0, increases rapidly to around 1.5, then decreases to around 0 at t=10, then remains at 0.
**Bottom-Right Plot: Individual Agent Tracking Performance**
* **Follower 1 Error - Blue:** Starts at approximately 0.5, decreases rapidly to around 0 at t=5, then remains at 0.
* **Leader Error (ref tracking) - Orange:** Starts at approximately -1, increases rapidly to around 0.3 at t=5, then converges to 0.
* **Follower 3 Error - Yellow:** Starts at approximately -1, increases rapidly to around 0, then converges to 0.
* **Follower 4 Error - Purple:** Starts at approximately -0.2, increases rapidly to around 0.1 at t=5, then converges to 0.
### Key Observations
* The agent states converge to a consensus around time t=2.5, as indicated by the "Consensus Achieved" line in the top-left plot.
* The control inputs for all agents converge to 0 over time.
* The consensus error decreases to 0 over time.
* The tracking errors for all agents converge to 0 over time.
### Interpretation
The plots demonstrate the successful implementation of a distributed control strategy for a leader-follower multi-agent system. The agents achieve consensus, meaning their states converge to a common value. The control inputs stabilize over time, and the tracking errors are minimized, indicating that the agents are effectively following the leader's reference trajectory. The "Consensus Achieved" line indicates the time at which the agents' states are considered to be in agreement. The total value function represents a cost or performance metric that is optimized over time.