TECHNICAL ASSET FINGERPRINT
4fd2bfe3e74601232452394a
Click to view fullscreen
Press ESC or click to close
FOUND IN PAPERS
EXPERT: healer-alpha-free VERSION 1
RUNTIME: free/openrouter/healer-alpha
INTEL_VERIFIED
## Composite Technical Figure: Multi-Agent System Performance Analysis
### Overview
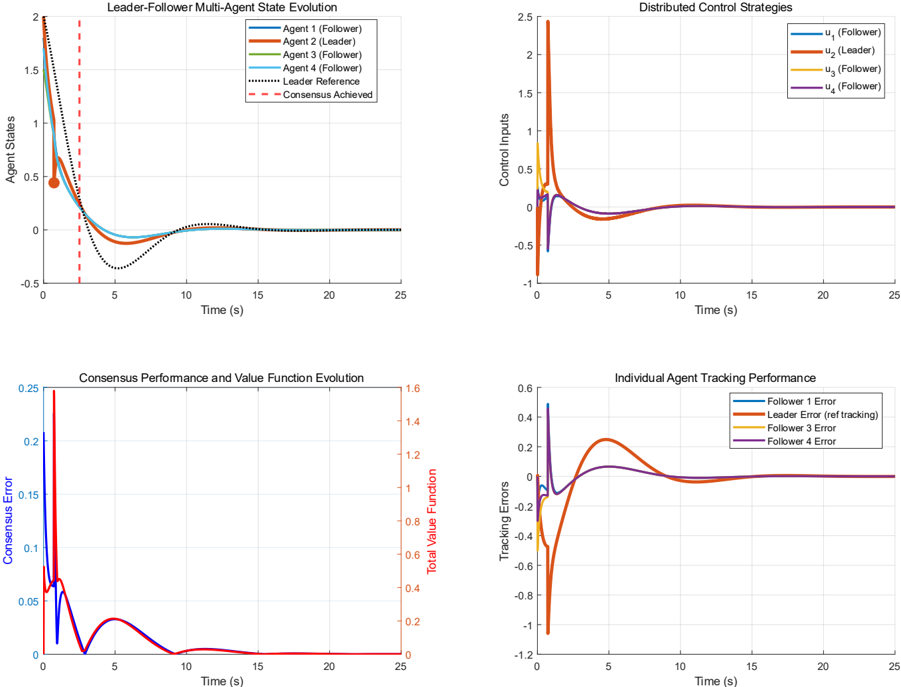
The image is a composite figure containing four distinct plots arranged in a 2x2 grid. It presents simulation results for a leader-follower multi-agent control system, showing state evolution, control inputs, consensus performance, and tracking errors over a 25-second time horizon. The overall narrative demonstrates a system achieving consensus and stable tracking after initial transient behavior.
### Components/Axes
The figure is divided into four quadrants:
1. **Top-Left:** "Leader-Follower Multi-Agent State Evolution"
2. **Top-Right:** "Distributed Control Strategies"
3. **Bottom-Left:** "Consensus Performance and Value Function Evolution"
4. **Bottom-Right:** "Individual Agent Tracking Performance"
All plots share a common x-axis: **Time (s)**, ranging from 0 to 25 seconds.
### Detailed Analysis
#### 1. Leader-Follower Multi-Agent State Evolution (Top-Left)
* **Y-axis:** "Agent States", scale from -0.5 to 2.
* **Legend (Top-Right of plot):**
* Agent 1 (Follower) - Blue line
* Agent 2 (Leader) - Red line
* Agent 3 (Follower) - Yellow line
* Agent 4 (Follower) - Purple line
* Leader Reference - Black dotted line
* Consensus Achieved - Red dashed vertical line
* **Data & Trends:**
* All agent states start at different initial conditions between approximately 0.5 and 2.
* The Leader Reference (black dotted) starts at 2 and decays smoothly towards 0.
* All follower agents (blue, yellow, purple) and the leader agent (red) rapidly converge towards the leader reference trajectory.
* A vertical red dashed line at **Time ≈ 3s** is labeled "Consensus Achieved", indicating the point where the agent states have tightly grouped.
* After t=5s, all states exhibit a small, synchronized undershoot below zero (minimum ≈ -0.1) before converging asymptotically to **0** by t=15s and remaining stable.
#### 2. Distributed Control Strategies (Top-Right)
* **Y-axis:** "Control Inputs", scale from -1 to 2.5.
* **Legend (Top-Right of plot):**
* u₁ (Follower) - Blue line
* u₂ (Leader) - Red line
* u₃ (Follower) - Yellow line
* u₄ (Follower) - Purple line
* **Data & Trends:**
* All control inputs show large, sharp spikes at the very beginning (t < 1s). The leader's control input (u₂, red) has the largest positive spike, reaching approximately **2.4**.
* Following the initial spike, all control signals exhibit a damped oscillatory response.
* The signals cross zero and show a negative dip around t=1-2s.
* By **t=10s**, all control inputs have effectively settled to **0** and remain there, indicating the system has reached a steady state requiring no further control effort.
#### 3. Consensus Performance and Value Function Evolution (Bottom-Left)
* **Primary Y-axis (Left):** "Consensus Error", scale from 0 to 0.25. (Blue line)
* **Secondary Y-axis (Right):** "Total Value Function", scale from 0 to 1.6. (Red line)
* **Data & Trends:**
* **Consensus Error (Blue):** Starts at a high value (≈0.25), drops sharply to near zero within the first second, then exhibits a small rebound peak (≈0.07) at t≈2s before decaying to **0** by t=10s.
* **Total Value Function (Red):** Starts at a high value (≈1.6), drops precipitously in the first second, then shows a series of decaying oscillations. Notable peaks occur at t≈2s (≈0.3) and t≈5s (≈0.15). It converges to **0** by approximately t=15s.
* The two metrics are correlated, with the value function showing more pronounced oscillations. Their convergence to zero indicates successful optimization and consensus.
#### 4. Individual Agent Tracking Performance (Bottom-Right)
* **Y-axis:** "Tracking Errors", scale from -1.2 to 0.6.
* **Legend (Top-Right of plot):**
* Follower 1 Error - Blue line
* Leader Error (ref tracking) - Red line
* Follower 3 Error - Yellow line
* Follower 4 Error - Purple line
* **Data & Trends:**
* This plot shows the error between each agent's state and the desired leader reference trajectory.
* Initial errors are large and varied: Leader Error (red) starts near **-1.2**, Follower 4 Error (purple) starts near **0.5**.
* All error signals undergo a large transient swing in the first 2-3 seconds.
* After the initial transient, the errors for all agents converge towards zero. The leader's tracking error (red) shows a positive overshoot (peak ≈0.25 at t≈5s) before settling.
* By **t=15s**, all tracking errors are negligible and remain at **0**, confirming perfect reference tracking in steady state.
### Key Observations
1. **Rapid Consensus:** The system achieves state consensus very quickly, marked at t≈3s.
2. **Stability:** All metrics (states, controls, errors, value function) converge to zero or a stable equilibrium by t=15s, demonstrating asymptotic stability.
3. **Leader Dominance:** The leader agent (Agent 2, u₂) exhibits the most aggressive initial control action and the largest initial tracking error, driving the system's response.
4. **Correlated Dynamics:** The oscillations in the consensus error, value function, and tracking errors are temporally aligned, indicating coupled system dynamics during the transient phase.
5. **Control Effort:** The control inputs are only significant during the initial transient phase (t<5s), after which they are minimal, suggesting an efficient control strategy.
### Interpretation
This composite figure provides a comprehensive performance validation of a distributed leader-follower control algorithm. The data demonstrates that the algorithm successfully solves the core problems of **consensus** (all agents agreeing on a state) and **tracking** (following a dynamic leader reference).
* **The "Consensus Achieved" line** is a key performance indicator, showing the algorithm's speed.
* The **convergence of the Total Value Function to zero** implies the underlying optimization or learning process has been successfully completed.
* The **settling of all control inputs to zero** indicates the system reaches a passive equilibrium, which is desirable for energy efficiency and stability.
* The **transient oscillations** visible in all plots are characteristic of underdamped system dynamics and provide insight into the damping ratios and natural frequencies of the closed-loop system.
The plots collectively tell a story of a well-designed multi-agent system that quickly organizes itself, follows a command, and then maintains a stable, zero-error state with minimal ongoing effort. The leader agent bears the brunt of the initial control action and error, which is typical in such architectures.
DECODING INTELLIGENCE...