## Diagram: Process Flow
### Overview
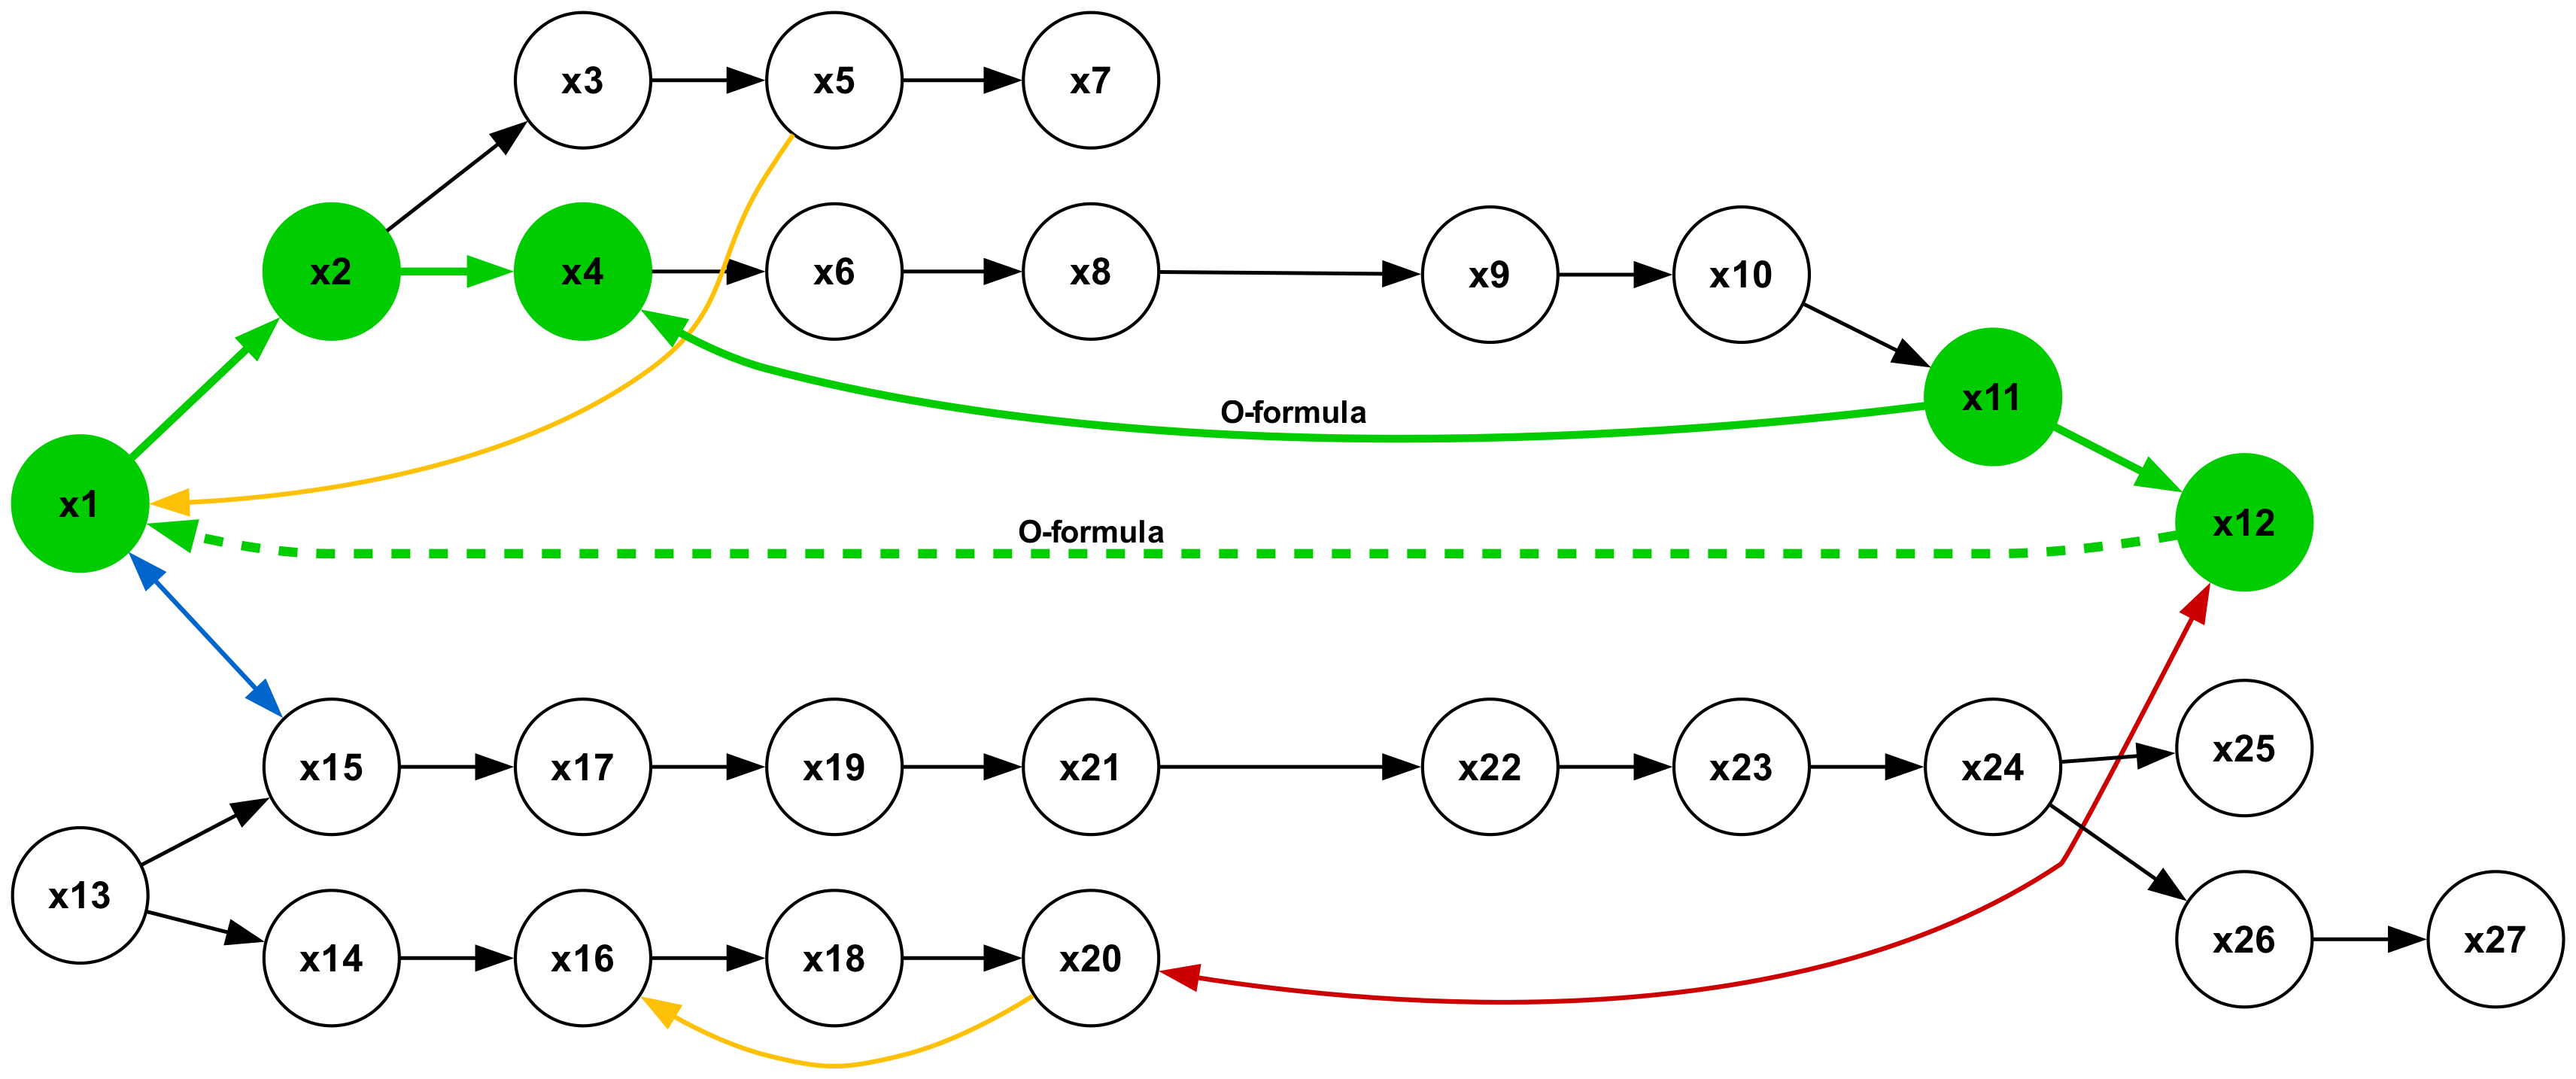
The image is a diagram illustrating a process flow with multiple interconnected steps. The process is represented by a series of nodes (circles) labeled with "x" followed by a number, indicating different stages or components. The connections between these nodes are shown with arrows, indicating the direction of the flow. Some connections are highlighted with different colors (green, yellow, red, blue) and line styles (solid, dashed), possibly indicating different types of relationships or processes. Some nodes are filled with green, while others are white.
### Components/Axes
* **Nodes:** Represented by circles labeled x1 through x27.
* **Arrows:** Indicate the direction of flow between nodes.
* **Colors:**
* Green: Indicates a specific type of connection or flow.
* Yellow: Indicates a specific type of connection or flow.
* Red: Indicates a specific type of connection or flow.
* Blue: Indicates a specific type of connection or flow.
* **Line Styles:**
* Solid: Standard flow.
* Dashed: "O-formula" flow.
* **Labels:** "O-formula" is written near the dashed green lines.
* **Node Fill Color:**
* Green: Indicates a specific type of node.
* White: Indicates a specific type of node.
### Detailed Analysis
* **Starting Point:** The process appears to originate from node x1, which is filled with green.
* **Top Branch:**
* x1 (green) -> x2 (green) -> x3 -> x5 -> x7
* x1 (green) -> x2 (green) -> x4 (green) -> x6 -> x8 -> x9 -> x10 -> x11 (green) -> x12 (green)
* x4 (green) has a yellow arrow back to x1 (green)
* x6 has a green arrow to x11 (green), labeled "O-formula"
* x1 (green) has a dashed green arrow to x12 (green), labeled "O-formula"
* **Bottom Branch:**
* x1 (green) -> x15 -> x17 -> x19 -> x21 -> x22 -> x23 -> x24 -> x25
* x13 -> x15
* x13 -> x14 -> x16 -> x18 -> x20
* x1 (green) -> x15 (blue arrow)
* x16 has a yellow arrow to x4 (green)
* x20 has a red arrow to x12 (green)
* x24 -> x26 -> x27
* x24 -> x25
### Key Observations
* Node x1 (green) seems to be a central point, with connections to multiple other nodes.
* Nodes x1, x2, x4, x11, and x12 are filled with green, potentially indicating key stages or components.
* The "O-formula" connections (dashed green lines) represent a specific type of relationship between nodes.
* The yellow and red arrows indicate feedback loops or alternative pathways.
* The blue arrow indicates a specific type of connection from x1 to x15.
### Interpretation
The diagram represents a complex process flow with multiple branches, feedback loops, and alternative pathways. The green-filled nodes likely represent key stages or components in the process. The different colored arrows and line styles indicate different types of relationships or processes between the nodes. The "O-formula" connections suggest a specific type of relationship or calculation. The diagram could be used to visualize and analyze the process, identify potential bottlenecks, and optimize the flow. The presence of feedback loops (yellow and red arrows) suggests that the process is iterative and can adapt to changing conditions. The blue arrow from x1 to x15 indicates a direct connection between the starting point and a node in the bottom branch.