\n
## Diagram: Process Flow with Feedback Loop
### Overview
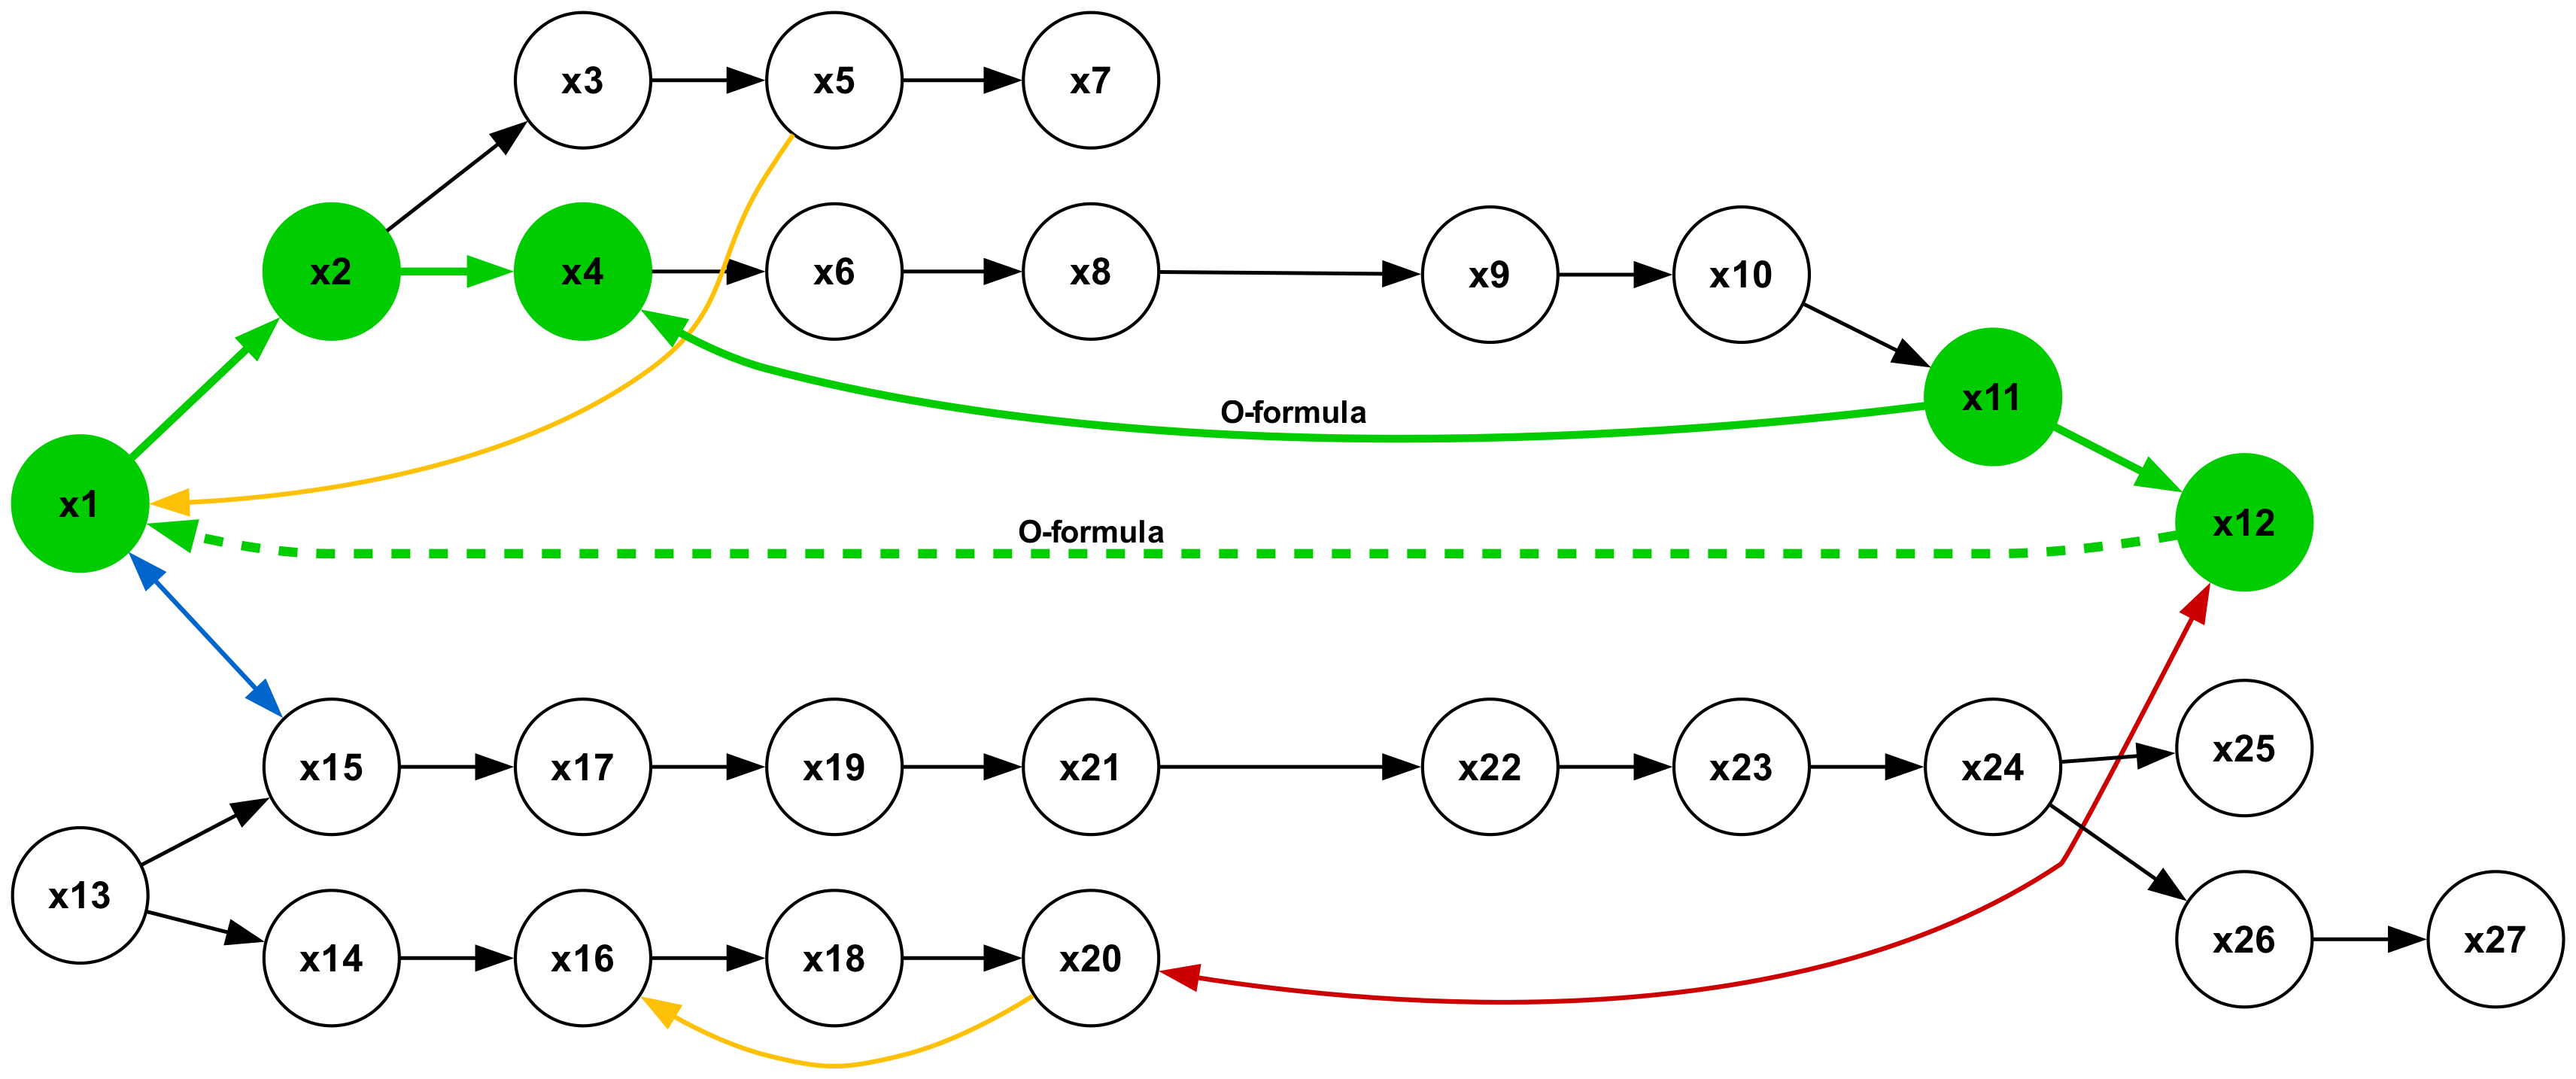
The image depicts a directed graph representing a process flow with a feedback loop. The diagram consists of 27 nodes labeled "x1" through "x27", connected by directed edges (arrows) indicating the flow of the process. Two nodes, x1 and x12, are highlighted in green, suggesting they are key starting or ending points. A dashed gray line connects x1 and x12, representing a feedback mechanism. The text "O-formula" appears twice, associated with edges, potentially indicating a transformation or calculation applied during the process.
### Components/Axes
The diagram does not have traditional axes. It consists of:
* **Nodes:** 27 circular nodes labeled x1 to x27.
* **Edges:** Directed arrows connecting the nodes, representing the process flow.
* **Feedback Loop:** A dashed gray line connecting x1 and x12.
* **Text Labels:** "O-formula" appearing twice.
* **Highlighted Nodes:** x1 and x12 are colored green.
### Detailed Analysis or Content Details
The process flow can be described as follows:
* **Starting Point:** x1 (green)
* **Path 1:** x1 -> x2 -> x3 -> x5 -> x7
* **Path 2:** x1 -> x2 -> x4 -> x6 -> x8 -> x9 -> x10 -> x11 -> x12 (green)
* **Path 3:** x1 -> x13 -> x15 -> x17 -> x19 -> x21 -> x22 -> x23 -> x24 -> x25 -> x26 -> x27
* **Path 4:** x1 -> x13 -> x14 -> x16 -> x18 -> x20
* **Feedback Loop:** x12 -> x1 (dashed gray line)
* **O-formula association:** The text "O-formula" is placed along the edge connecting x8 to x9 and along the dashed feedback loop from x12 to x1.
The connections are as follows:
* x1 connects to x2 and x13.
* x2 connects to x3 and x4.
* x3 connects to x5.
* x4 connects to x6.
* x5 connects to x7.
* x6 connects to x8.
* x7 has no outgoing connections.
* x8 connects to x9.
* x9 connects to x10.
* x10 connects to x11.
* x11 connects to x12.
* x12 connects to x1.
* x13 connects to x14 and x15.
* x14 connects to x16.
* x15 connects to x17.
* x16 connects to x18.
* x17 connects to x19.
* x18 connects to x20.
* x19 connects to x21.
* x20 has no outgoing connections.
* x21 connects to x22.
* x22 connects to x23.
* x23 connects to x24.
* x24 connects to x25.
* x25 connects to x26.
* x26 connects to x27.
* x27 has no outgoing connections.
### Key Observations
* The diagram represents a complex process with multiple parallel paths.
* The green nodes (x1 and x12) likely represent significant states or stages in the process.
* The feedback loop from x12 to x1 suggests an iterative or self-correcting process.
* The "O-formula" label indicates a specific operation or calculation is performed at certain points in the process.
* Paths 3 and 4 terminate at x27 and x20 respectively, suggesting these are end points for those specific branches.
### Interpretation
The diagram illustrates a system where a process begins at x1, branches into multiple pathways, and ultimately converges (or provides output) at x12. The feedback loop from x12 to x1 suggests that the output of the process influences the initial state, creating a dynamic system. The "O-formula" likely represents a key transformation or calculation that drives the process. The multiple paths suggest that the system can handle different inputs or scenarios. The termination points x20 and x27 suggest that the process can lead to different outcomes depending on the path taken.
The diagram could represent a control system, a machine learning algorithm, or a complex workflow. The specific meaning of the nodes and edges would depend on the context in which the diagram is used. The presence of a feedback loop suggests a system that is capable of learning or adapting over time. The diagram is a high-level representation of a process and does not provide details about the specific operations performed at each stage.