## Directed Graph Diagram: Process Flow with Feedback Loops
### Overview
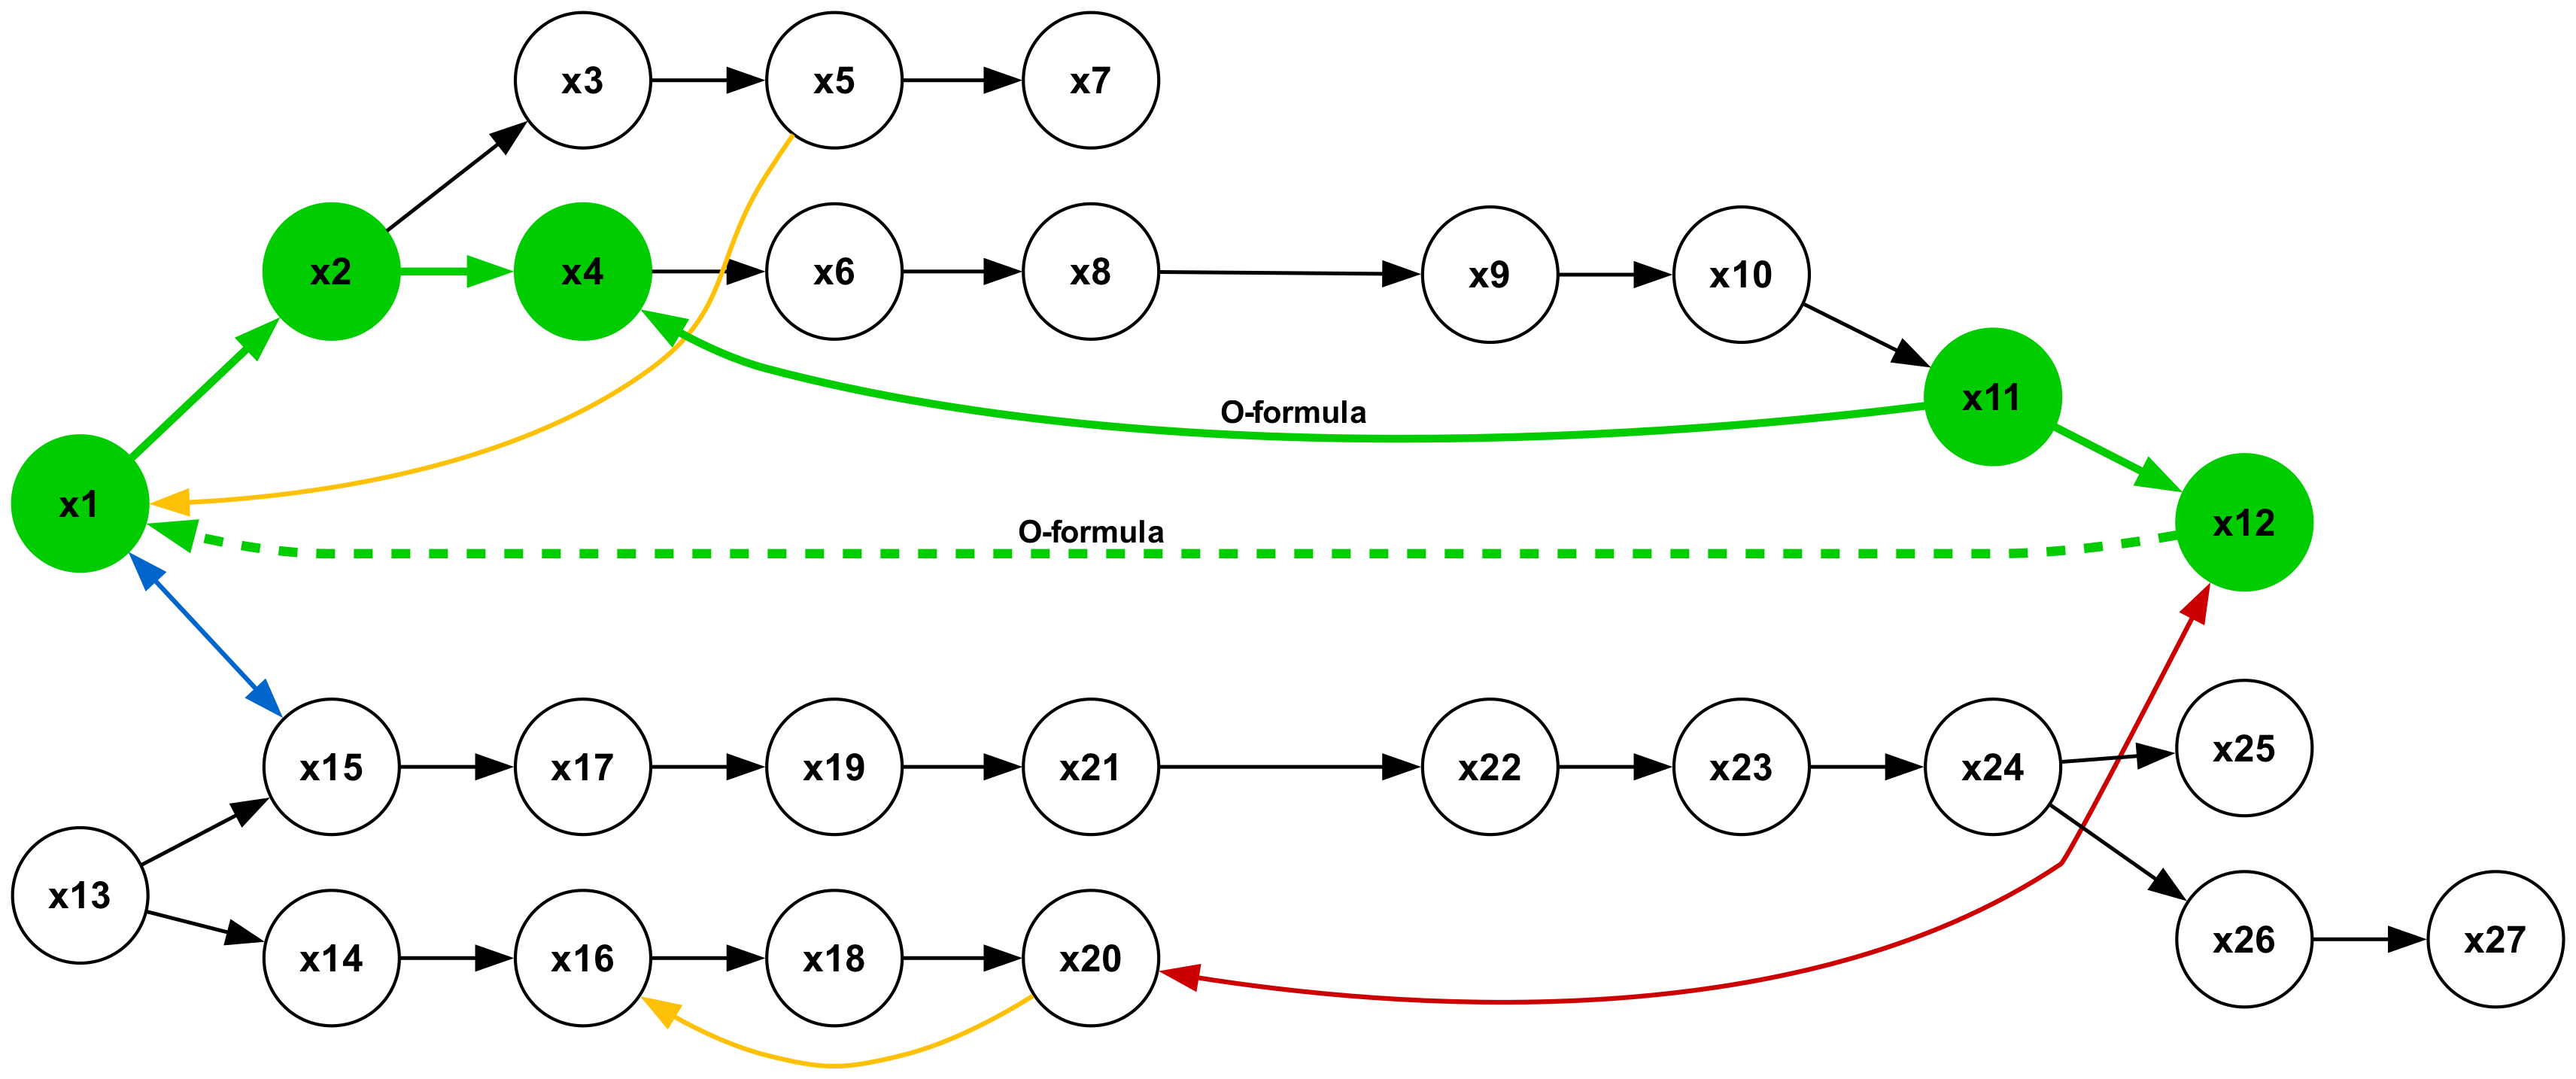
The image displays a directed graph (network diagram) consisting of 27 circular nodes labeled `x1` through `x27`. The nodes are interconnected by directed arrows of various colors, indicating different types of relationships or flows. Some nodes are highlighted in green, while others are white. Two specific connections are labeled with the text "O-formula". The diagram appears to model a complex process, system, or algorithm with multiple pathways, convergence points, and feedback loops.
### Components/Axes
* **Nodes:** 27 circular nodes, each containing a unique label from `x1` to `x27`.
* **Green Nodes:** `x1`, `x2`, `x4`, `x11`, `x12`. These appear to be key states, milestones, or active components.
* **White Nodes:** All other nodes (`x3`, `x5`, `x6`, `x7`, `x8`, `x9`, `x10`, `x13`, `x14`, `x15`, `x16`, `x17`, `x18`, `x19`, `x20`, `x21`, `x22`, `x23`, `x24`, `x25`, `x26`, `x27`).
* **Edges (Arrows):** Directed connections between nodes, differentiated by color and style.
* **Green Solid Arrows:** Indicate a primary or positive flow. Examples: `x1 -> x2`, `x2 -> x4`, `x4 -> x11` (labeled "O-formula"), `x11 -> x12`.
* **Black Solid Arrows:** The most common connection type, indicating standard sequential flow. Examples: `x3 -> x5`, `x6 -> x8`, `x15 -> x17`.
* **Yellow/Orange Solid Arrows:** Indicate an alternative or special flow. Examples: `x1 -> x4`, `x5 -> x4`, `x18 -> x16`.
* **Blue Solid Arrow:** A single instance connecting `x1 -> x15`.
* **Red Solid Arrows:** Indicate a reverse or feedback flow. Examples: `x24 -> x20`, `x24 -> x12`.
* **Green Dashed Arrow:** A special feedback connection from `x12 -> x1`, labeled "O-formula".
* **Text Labels:** The phrase "O-formula" appears twice, labeling two specific green arrows.
### Detailed Analysis
**Node Connectivity and Pathways:**
1. **Upper Primary Path (Green Initiation):**
* Starts at green node `x1`.
* `x1` branches to `x2` (green arrow) and `x15` (blue arrow).
* From `x2` (green), flow goes to `x3` (black) and `x4` (green).
* From `x4` (green), flow splits: one path goes to `x6` (black), and a labeled green "O-formula" arrow goes to `x11` (green).
* The path from `x6` continues linearly: `x6 -> x8 -> x9 -> x10 -> x11`.
* From `x11` (green), flow goes to `x12` (green).
* A dashed green "O-formula" arrow creates a feedback loop from `x12` back to `x1`.
2. **Lower Path (Initiated from `x13` and `x1`):**
* Starts at white node `x13`.
* `x13` branches to `x15` and `x14`.
* The `x15` branch (also receiving input from `x1` via blue arrow) continues: `x15 -> x17 -> x19 -> x21 -> x22 -> x23 -> x24`.
* The `x14` branch continues: `x14 -> x16 -> x18 -> x20`.
* A yellow arrow creates a local feedback from `x20` back to `x16`.
3. **Convergence and Final Outputs:**
* Node `x24` is a major convergence point. It receives flow from `x23`.
* From `x24`, flow splits into three directions:
* To `x25` (black arrow).
* To `x26` (black arrow), which then goes to `x27`.
* A red feedback arrow to `x20`.
* A red feedback arrow to green node `x12`.
**"O-formula" Connections:**
* **Solid Green Arrow:** From `x4` to `x11`. This represents a direct, possibly optimized or formulaic, pathway bypassing the intermediate nodes `x6`, `x8`, `x9`, and `x10`.
* **Dashed Green Arrow:** From `x12` back to `x1`. This represents a major system-level feedback loop, suggesting the process is cyclical or iterative, where the final state (`x12`) influences the initial state (`x1`).
### Key Observations
1. **Green Node Significance:** The green nodes (`x1`, `x2`, `x4`, `x11`, `x12`) form a critical backbone or control path through the upper section of the graph. They are involved in the "O-formula" shortcuts and the main feedback loop.
2. **Multiple Feedback Loops:** The system contains at least four feedback mechanisms:
* The major "O-formula" loop (`x12 -> x1`).
* The "O-formula" shortcut (`x4 -> x11`).
* A local loop in the lower path (`x20 -> x16`).
* Two red feedback paths from the convergence node `x24` back to `x20` and `x12`.
3. **Pathway Redundancy and Convergence:** There are multiple routes to reach key nodes. For example, `x11` can be reached via the long path (`x4->x6->...->x10`) or the direct "O-formula" path. Node `x24` acts as a funnel for the entire lower subsystem before distributing to final nodes (`x25`, `x26`, `x27`) and feeding back.
4. **Color-Coded Semantics:** The arrow colors likely denote different types of relationships (e.g., standard flow, optimization, feedback, initialization).
### Interpretation
This diagram models a complex, state-based system with both feedforward and feedback dynamics. The "O-formula" labels suggest the presence of mathematical or logical shortcuts that optimize part of the process. The structure implies a system that is not purely linear; it has parallel processing (the two main branches from `x1` and `x13`), convergence points (`x11`, `x24`), and cyclical behavior driven by feedback loops.
The green nodes likely represent stable, validated, or control states within the system. The feedback from `x12` to `x1` indicates an iterative process where the output of one cycle becomes the input for the next, common in algorithms, control systems, or learning models. The red feedback arrows from `x24` suggest that later-stage outcomes are used to regulate or adjust earlier states (`x20`, `x12`), which is characteristic of adaptive or self-correcting systems.
In essence, the graph depicts a sophisticated process where information or control flows through defined pathways, with mechanisms for optimization ("O-formula") and regulation (multiple feedback loops) to achieve a dynamic, possibly goal-oriented, operation.