# Technical Document Extraction: Flowchart Analysis
## 1. **Component Identification**
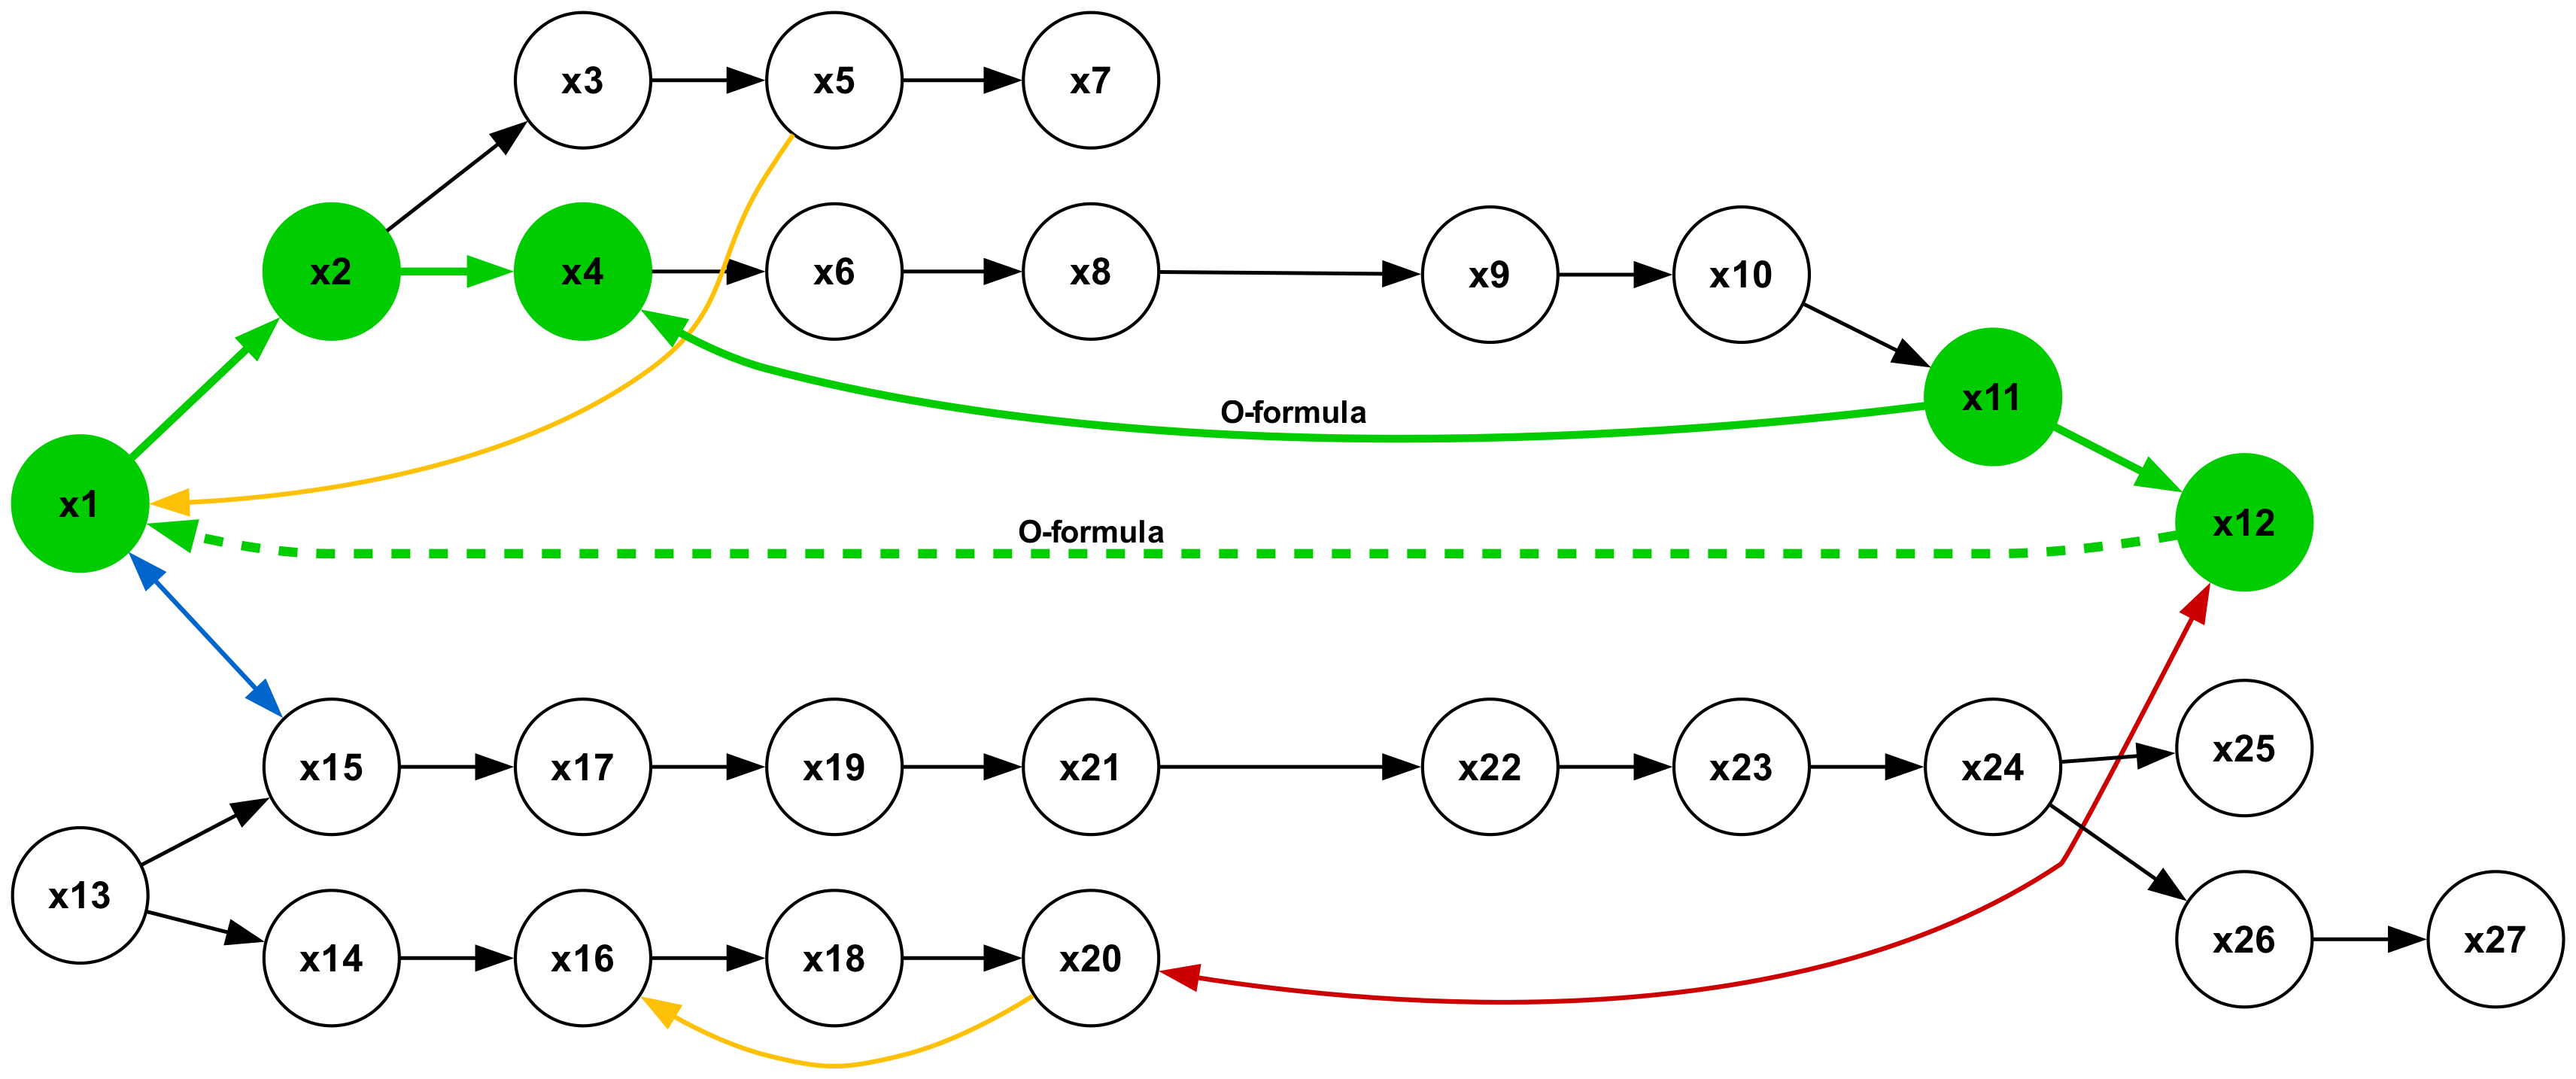
The image is a **directed graph (flowchart)** with **27 nodes** labeled `x1` to `x27`. Nodes are represented as circles, and edges (arrows) indicate directional relationships. Key elements include:
- **Colored Arrows**: Black, green, yellow, red, and blue.
- **Dashed Green Line**: Connects `x1` and `x12`.
- **Labeled Arrows**: Green arrows labeled "O-formula".
## 2. **Node Structure**
Nodes are organized in a **hierarchical and branching structure**:
- **Top-Level Nodes**: `x1`, `x2`, `x3`, `x4`, `x5`, `x6`, `x7`, `x8`, `x9`, `x10`, `x11`, `x12`.
- **Middle-Level Nodes**: `x13`, `x14`, `x15`, `x16`, `x17`, `x18`, `x19`, `x20`, `x21`, `x22`, `x23`, `x24`, `x25`, `x26`, `x27`.
## 3. **Edge Analysis**
### **Green Arrows (O-formula)**
- **Labeled "O-formula"**: Connects:
- `x2` → `x4`
- `x4` → `x6`
- `x6` → `x8`
- `x8` → `x9`
- `x9` → `x10`
- `x10` → `x11`
- `x11` → `x12`
- **Dashed Green Line**: Connects `x1` and `x12` (no label).
### **Other Arrows**
- **Black Arrows**: Standard directional edges (no labels).
- **Yellow Arrows**:
- `x1` → `x2`
- `x13` → `x14`
- `x16` → `x18`
- `x20` → `x25`
- **Red Arrow**: `x24` → `x25` (no label).
- **Blue Arrow**: `x1` → `x15` (no label).
## 4. **Flowchart Logic**
### **Upper Pathway (x1 → x12)**
1. `x1` branches to `x2` (yellow) and `x13` (blue).
2. `x2` → `x4` (green, O-formula).
3. `x4` → `x6` (green, O-formula).
4. `x6` → `x8` (green, O-formula).
5. `x8` → `x9` (black).
6. `x9` → `x10` (black).
7. `x10` → `x11` (black).
8. `x11` → `x12` (green, O-formula).
9. `x12` connects to `x25` (red arrow).
### **Lower Pathway (x13 → x27)**
1. `x13` branches to `x14` (black) and `x15` (blue).
2. `x14` → `x16` (black).
3. `x16` → `x18` (yellow).
4. `x18` → `x20` (black).
5. `x20` → `x25` (red arrow).
6. `x25` → `x26` (black).
7. `x26` → `x27` (black).
## 5. **Key Observations**
- **O-formula Path**: The green arrows form a **linear chain** from `x2` to `x12`, suggesting a sequential process or formula application.
- **Branching Logic**: `x1` and `x13` act as **decision points** with multiple outgoing edges.
- **Red Arrow**: `x24` → `x25` introduces a **non-linear deviation** in the lower pathway.
- **Dashed Green Line**: Implies a **direct connection** between `x1` and `x12`, bypassing intermediate nodes.
## 6. **Legend and Color Mapping**
- **No Explicit Legend**: Colors are self-explanatory in the diagram.
- **Color-to-Label Mapping**:
- **Green**: "O-formula" (explicit label).
- **Red**: Unlabeled edge (possible error or special case).
- **Blue/Yellow**: Unlabeled edges (likely auxiliary paths).
## 7. **Spatial Grounding**
- **Nodes**: Arranged in a **top-to-bottom hierarchy** with horizontal branching.
- **Dashed Line**: Connects `x1` (top-left) and `x12` (middle-right).
- **Red Arrow**: Connects `x24` (lower-middle) to `x25` (lower-right).
## 8. **Trend Verification**
- **O-formula Path**: Linear progression from `x2` to `x12` (no upward/downward trend).
- **Lower Pathway**: Branching increases complexity, with `x20` acting as a **convergence point** for multiple paths.
## 9. **Missing Elements**
- **No Data Table**: The image is a flowchart, not a chart with numerical data.
- **No Axis Titles/Legends**: Diagram lacks quantitative axes or legends.
## 10. **Conclusion**
The flowchart represents a **process flow** with:
- A **primary O-formula pathway** (green arrows).
- **Branching logic** (yellow/blue arrows).
- A **non-linear deviation** (red arrow).
- A **direct connection** (dashed green line) between `x1` and `x12`.
This structure suggests a **hierarchical decision-making or computational process** with multiple execution paths.