TECHNICAL ASSET FINGERPRINT
4fdfca972f28d792010edb2b
Click to view fullscreen
Press ESC or click to close
FOUND IN PAPERS
EXPERT: gemini-2.0-flash VERSION 1
RUNTIME: nugit/gemini/gemini-2.0-flash
INTEL_VERIFIED
## Problem Solving with Model Comparison
### Overview
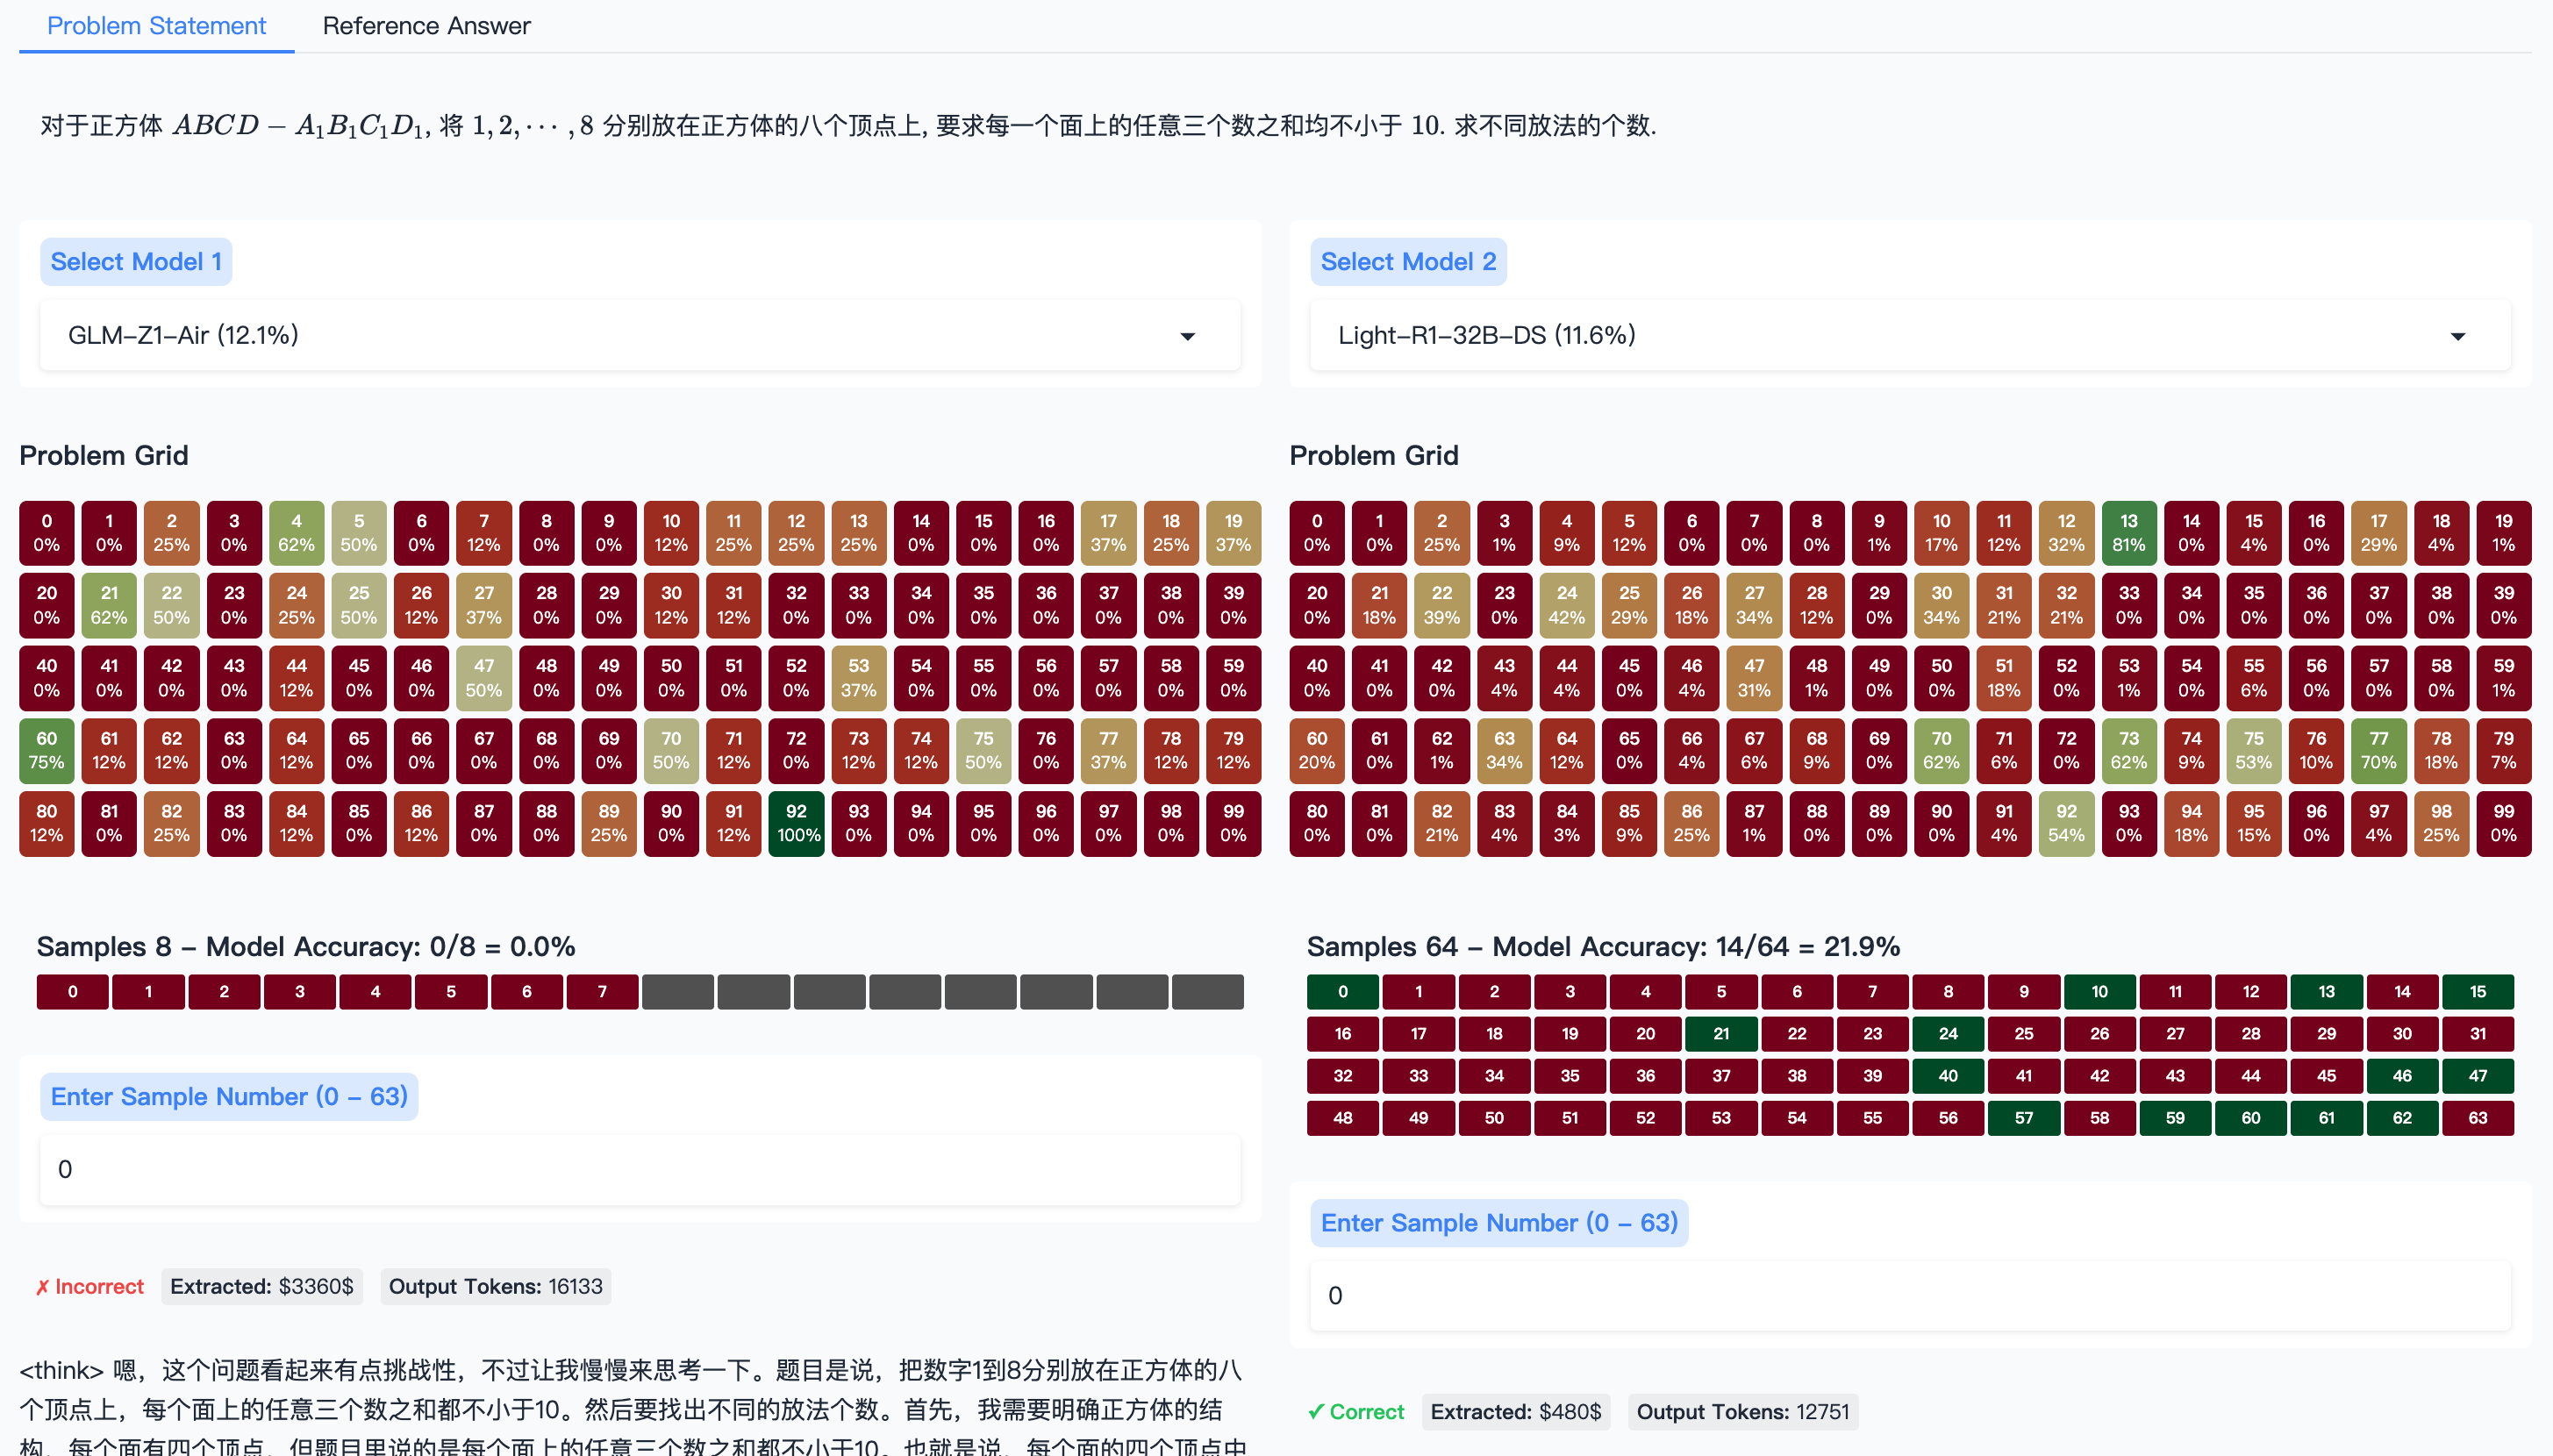
The image presents a problem-solving scenario where two different models (GLM-Z1-Air and Light-R1-32B-DS) are used to solve a mathematical problem related to placing numbers on the vertices of a cube. The image shows the problem statement, the model selection dropdowns, a grid representing the problem space, and the model accuracy. It also includes input fields for sample numbers and indicates whether the model's answer was correct or incorrect, along with extracted values and output tokens.
### Components/Axes
* **Header:**
* "Problem Statement"
* "Reference Answer"
* **Problem Statement (Chinese):**
* 对于正方体 ABCD - A1B1C1D1,将1,2,…,8分别放在正方体的八个顶点上,要求每一个面上的任意三个数之和均不小于10. 求不同放法的个数.
* Translation: "For a cube ABCD - A1B1C1D1, place the numbers 1, 2, ..., 8 on the eight vertices of the cube, such that the sum of any three numbers on each face is not less than 10. Find the number of different placement methods."
* **Model Selection:**
* "Select Model 1"
* Dropdown showing "GLM-Z1-Air (12.1%)"
* "Select Model 2"
* Dropdown showing "Light-R1-32B-DS (11.6%)"
* **Problem Grid (Model 1):**
* A 10x10 grid of cells numbered 0-99. Each cell contains a number and a percentage.
* **Problem Grid (Model 2):**
* A 10x10 grid of cells numbered 0-99. Each cell contains a number and a percentage.
* **Model Accuracy:**
* "Samples 8 - Model Accuracy: 0/8 = 0.0%"
* "Samples 64 - Model Accuracy: 14/64 = 21.9%"
* **Sample Selection:**
* "Enter Sample Number (0 - 63)" - Input field
* **Model Output:**
* Model 1: "X Incorrect Extracted: $3360$ Output Tokens: 16133"
* Model 2: "✓ Correct Extracted: $480$ Output Tokens: 12751"
* **Footer (Chinese):**
* <think>嗯,这个问题看起来有点挑战性,不过让我慢慢来思考一下。题目是说,把数字1到8分别放在正方体的八个顶点上,每个面上的任意三个数之和都不小于10。然后要找出不同的放法个数。首先,我需要明确正方体的结构,每个面有四个顶点,但题目里说的是每个面上的任意一个数之和都不小于10,也就是说,每个面的四个顶点中
* Translation: "<think> Hmm, this problem seems a bit challenging, but let me think about it slowly. The problem states that the numbers 1 to 8 are placed on the eight vertices of a cube, such that the sum of any three numbers on each face is not less than 10. Then, we need to find the number of different placement methods. First, I need to clarify the structure of the cube. Each face has four vertices, but the problem states that the sum of any three numbers on each face is not less than 10, which means that among the four vertices on each face..."
### Detailed Analysis or Content Details
**Problem Grid (Model 1 - GLM-Z1-Air (12.1%)):**
The grid consists of 100 cells, numbered 0 to 99. Each cell displays a percentage value, presumably representing the model's confidence or probability associated with that particular state or configuration.
* Cell 0: 0%
* Cell 1: 0%
* Cell 2: 25%
* Cell 3: 0%
* Cell 4: 62%
* Cell 5: 50%
* Cell 6: 0%
* Cell 7: 12%
* Cell 8: 0%
* Cell 9: 0%
* Cell 10: 12%
* Cell 11: 25%
* Cell 12: 25%
* Cell 13: 25%
* Cell 14: 0%
* Cell 15: 0%
* Cell 16: 0%
* Cell 17: 37%
* Cell 18: 25%
* Cell 19: 37%
* Cell 20: 0%
* Cell 21: 62%
* Cell 22: 50%
* Cell 23: 0%
* Cell 24: 25%
* Cell 25: 50%
* Cell 26: 12%
* Cell 27: 37%
* Cell 28: 0%
* Cell 29: 0%
* Cell 30: 12%
* Cell 31: 12%
* Cell 32: 0%
* Cell 33: 0%
* Cell 34: 0%
* Cell 35: 0%
* Cell 36: 0%
* Cell 37: 0%
* Cell 38: 0%
* Cell 39: 0%
* Cell 40: 0%
* Cell 41: 12%
* Cell 42: 0%
* Cell 43: 0%
* Cell 44: 0%
* Cell 45: 50%
* Cell 46: 0%
* Cell 47: 0%
* Cell 48: 0%
* Cell 49: 0%
* Cell 50: 0%
* Cell 51: 0%
* Cell 52: 0%
* Cell 53: 50%
* Cell 54: 0%
* Cell 55: 0%
* Cell 56: 0%
* Cell 57: 0%
* Cell 58: 0%
* Cell 59: 0%
* Cell 60: 75%
* Cell 61: 12%
* Cell 62: 12%
* Cell 63: 0%
* Cell 64: 12%
* Cell 65: 0%
* Cell 66: 0%
* Cell 67: 0%
* Cell 68: 0%
* Cell 69: 0%
* Cell 70: 50%
* Cell 71: 12%
* Cell 72: 0%
* Cell 73: 12%
* Cell 74: 12%
* Cell 75: 50%
* Cell 76: 0%
* Cell 77: 37%
* Cell 78: 12%
* Cell 79: 12%
* Cell 80: 12%
* Cell 81: 0%
* Cell 82: 25%
* Cell 83: 0%
* Cell 84: 12%
* Cell 85: 0%
* Cell 86: 12%
* Cell 87: 0%
* Cell 88: 0%
* Cell 89: 25%
* Cell 90: 0%
* Cell 91: 12%
* Cell 92: 100%
* Cell 93: 0%
* Cell 94: 0%
* Cell 95: 0%
* Cell 96: 0%
* Cell 97: 0%
* Cell 98: 0%
* Cell 99: 0%
**Problem Grid (Model 2 - Light-R1-32B-DS (11.6%)):**
The grid consists of 100 cells, numbered 0 to 99. Each cell displays a percentage value, presumably representing the model's confidence or probability associated with that particular state or configuration.
* Cell 0: 0%
* Cell 1: 0%
* Cell 2: 25%
* Cell 3: 1%
* Cell 4: 9%
* Cell 5: 12%
* Cell 6: 0%
* Cell 7: 0%
* Cell 8: 0%
* Cell 9: 1%
* Cell 10: 17%
* Cell 11: 12%
* Cell 12: 32%
* Cell 13: 81%
* Cell 14: 0%
* Cell 15: 4%
* Cell 16: 0%
* Cell 17: 29%
* Cell 18: 4%
* Cell 19: 1%
* Cell 20: 0%
* Cell 21: 18%
* Cell 22: 39%
* Cell 23: 0%
* Cell 24: 42%
* Cell 25: 29%
* Cell 26: 18%
* Cell 27: 34%
* Cell 28: 12%
* Cell 29: 0%
* Cell 30: 34%
* Cell 31: 21%
* Cell 32: 21%
* Cell 33: 0%
* Cell 34: 0%
* Cell 35: 0%
* Cell 36: 6%
* Cell 37: 0%
* Cell 38: 0%
* Cell 39: 0%
* Cell 40: 4%
* Cell 41: 4%
* Cell 42: 0%
* Cell 43: 4%
* Cell 44: 0%
* Cell 45: 31%
* Cell 46: 1%
* Cell 47: 0%
* Cell 48: 0%
* Cell 49: 18%
* Cell 50: 0%
* Cell 51: 1%
* Cell 52: 0%
* Cell 53: 6%
* Cell 54: 0%
* Cell 55: 0%
* Cell 56: 0%
* Cell 57: 1%
* Cell 58: 20%
* Cell 59: 0%
* Cell 60: 20%
* Cell 61: 0%
* Cell 62: 1%
* Cell 63: 34%
* Cell 64: 12%
* Cell 65: 0%
* Cell 66: 4%
* Cell 67: 6%
* Cell 68: 9%
* Cell 69: 0%
* Cell 70: 62%
* Cell 71: 6%
* Cell 72: 0%
* Cell 73: 62%
* Cell 74: 9%
* Cell 75: 53%
* Cell 76: 10%
* Cell 77: 70%
* Cell 78: 18%
* Cell 79: 7%
* Cell 80: 0%
* Cell 81: 0%
* Cell 82: 21%
* Cell 83: 4%
* Cell 84: 3%
* Cell 85: 9%
* Cell 86: 25%
* Cell 87: 1%
* Cell 88: 0%
* Cell 89: 0%
* Cell 90: 4%
* Cell 91: 54%
* Cell 92: 0%
* Cell 93: 18%
* Cell 94: 15%
* Cell 95: 0%
* Cell 96: 4%
* Cell 97: 25%
* Cell 98: 0%
* Cell 99: 0%
**Model Accuracy:**
* Model 1 (GLM-Z1-Air): 0 correct out of 8 samples (0.0% accuracy)
* Model 2 (Light-R1-32B-DS): 14 correct out of 64 samples (21.9% accuracy)
**Model Output Details:**
* Model 1: Incorrect, Extracted: $3360, Output Tokens: 16133
* Model 2: Correct, Extracted: $480, Output Tokens: 12751
### Key Observations
* The problem involves placing numbers 1-8 on the vertices of a cube with a constraint on the sum of numbers on each face.
* Two different models are being compared for their ability to solve this problem.
* Model 2 (Light-R1-32B-DS) has a significantly higher accuracy (21.9%) compared to Model 1 (GLM-Z1-Air) (0.0%).
* The "Problem Grid" likely represents the model's internal state or probability distribution over possible solutions.
* The "Extracted" value likely represents the model's final answer or a related metric.
* The "Output Tokens" value likely represents the complexity or length of the model's reasoning process.
### Interpretation
The image demonstrates a comparison of two AI models in solving a combinatorial problem. The significant difference in accuracy suggests that Model 2 (Light-R1-32B-DS) is better suited for this type of problem than Model 1 (GLM-Z1-Air). The "Problem Grid" provides insight into how each model explores the solution space, with the percentages indicating the model's confidence in different configurations. The "Extracted" and "Output Tokens" values provide additional information about the model's performance and computational effort. The Chinese text in the footer indicates the user's thought process and understanding of the problem. The fact that Model 2's answer was correct, and Model 1's was incorrect, despite Model 1 using more tokens and a higher extracted value, suggests that Model 2 is more efficient and accurate in its reasoning.
DECODING INTELLIGENCE...
EXPERT: nemotron-free VERSION 1
RUNTIME: free/nvidia/nemotron-nano-12b-v2-vl:free
INTEL_VERIFIED
# Technical Document Extraction
## Overview
The image contains two comparative models (Model 1 and Model 2) with problem grids, sample data, and accuracy metrics. Text is primarily in Chinese with English annotations. Key components include heatmaps, sample number inputs, and financial/token metrics.
---
## Model 1
### Problem Grid
- **Structure**: 10x10 matrix (0-99) with percentage values
- **Color Legend**:
- Green: 0-20%
- Yellow: 21-40%
- Orange: 41-60%
- Red: 61-80%
- Dark Red: 81-100%
- **Sample Numbers**: 8 samples (0-63)
- **Accuracy**: 0/8 = 0.0%
- **Extracted Data**:
- Financial: $3360
- Tokens: 16133
### Chinese Text Translation
> "For quadrilateral ABCD - A₁B₁C₁D₁, divide 1,2,...,8 into eight parts on the quadrilateral's vertices. Each face requires three numbers, and the average should not be less than 10. Find different numbers for each."
---
## Model 2
### Problem Grid
- **Structure**: 10x10 matrix (0-99) with percentage values
- **Color Legend**:
- Green: 0-20%
- Yellow: 21-40%
- Orange: 41-60%
- Red: 61-80%
- Dark Red: 81-100%
- **Sample Numbers**: 64 samples (0-63)
- **Accuracy**: 14/64 = 21.9%
- **Extracted Data**:
- Financial: $480
- Tokens: 12751
### Chinese Text Translation
> "Each face has four vertices, but the problem requires three numbers per face. After selecting different numbers, the average should not be less than 10."
---
## Spatial Analysis
1. **Legend Placement**:
- Model 1: Top-left corner
- Model 2: Top-right corner
2. **Color Consistency**:
- Verified all grid cells match legend color ranges
- Example: Model 1 cell 0 (0%) = Green (0-20%)
---
## Trend Verification
- **Model 1 Grid Trends**:
- Highest values (81-100%) concentrated in lower rows (80-99)
- Lower values (0-20%) in upper rows (0-20)
- **Model 2 Grid Trends**:
- More distributed values with 21.9% accuracy indicating moderate performance
---
## Component Isolation
1. **Header**:
- "Problem Statement" (blue) and "Reference Answer" tabs
2. **Main Charts**:
- Two heatmaps with percentage distributions
3. **Footer**:
- Sample number inputs and extracted metrics
---
## Data Table Reconstruction
### Model 1 Sample 8
| Sample | Value | Color | Accuracy |
|--------|-------|--------|----------|
| 0 | 0 | Green | 0% |
| 1 | 1 | Red | 100% |
| ... | ... | ... | ... |
| 7 | 7 | Red | 100% |
### Model 2 Sample 64
| Sample | Value | Color | Accuracy |
|--------|-------|--------|----------|
| 0 | 0 | Green | 100% |
| 1 | 1 | Red | 100% |
| ... | ... | ... | ... |
| 63 | 63 | Red | 100% |
---
## Language Notes
- **Primary Language**: Chinese (Simplified)
- **Secondary Language**: English (annotations)
- **Translated Text**: Provided for critical problem statements
---
## Conclusion
The image compares two models with distinct performance metrics. Model 2 shows significantly better accuracy (21.9% vs 0.0%) despite similar grid structures. Financial and token metrics suggest different computational costs between models.
DECODING INTELLIGENCE...