TECHNICAL ASSET FINGERPRINT
4fdfca972f28d792010edb2b
Click to view fullscreen
Press ESC or click to close
FOUND IN PAPERS
EXPERT: healer-alpha-free VERSION 1
RUNTIME: free/openrouter/healer-alpha
INTEL_VERIFIED
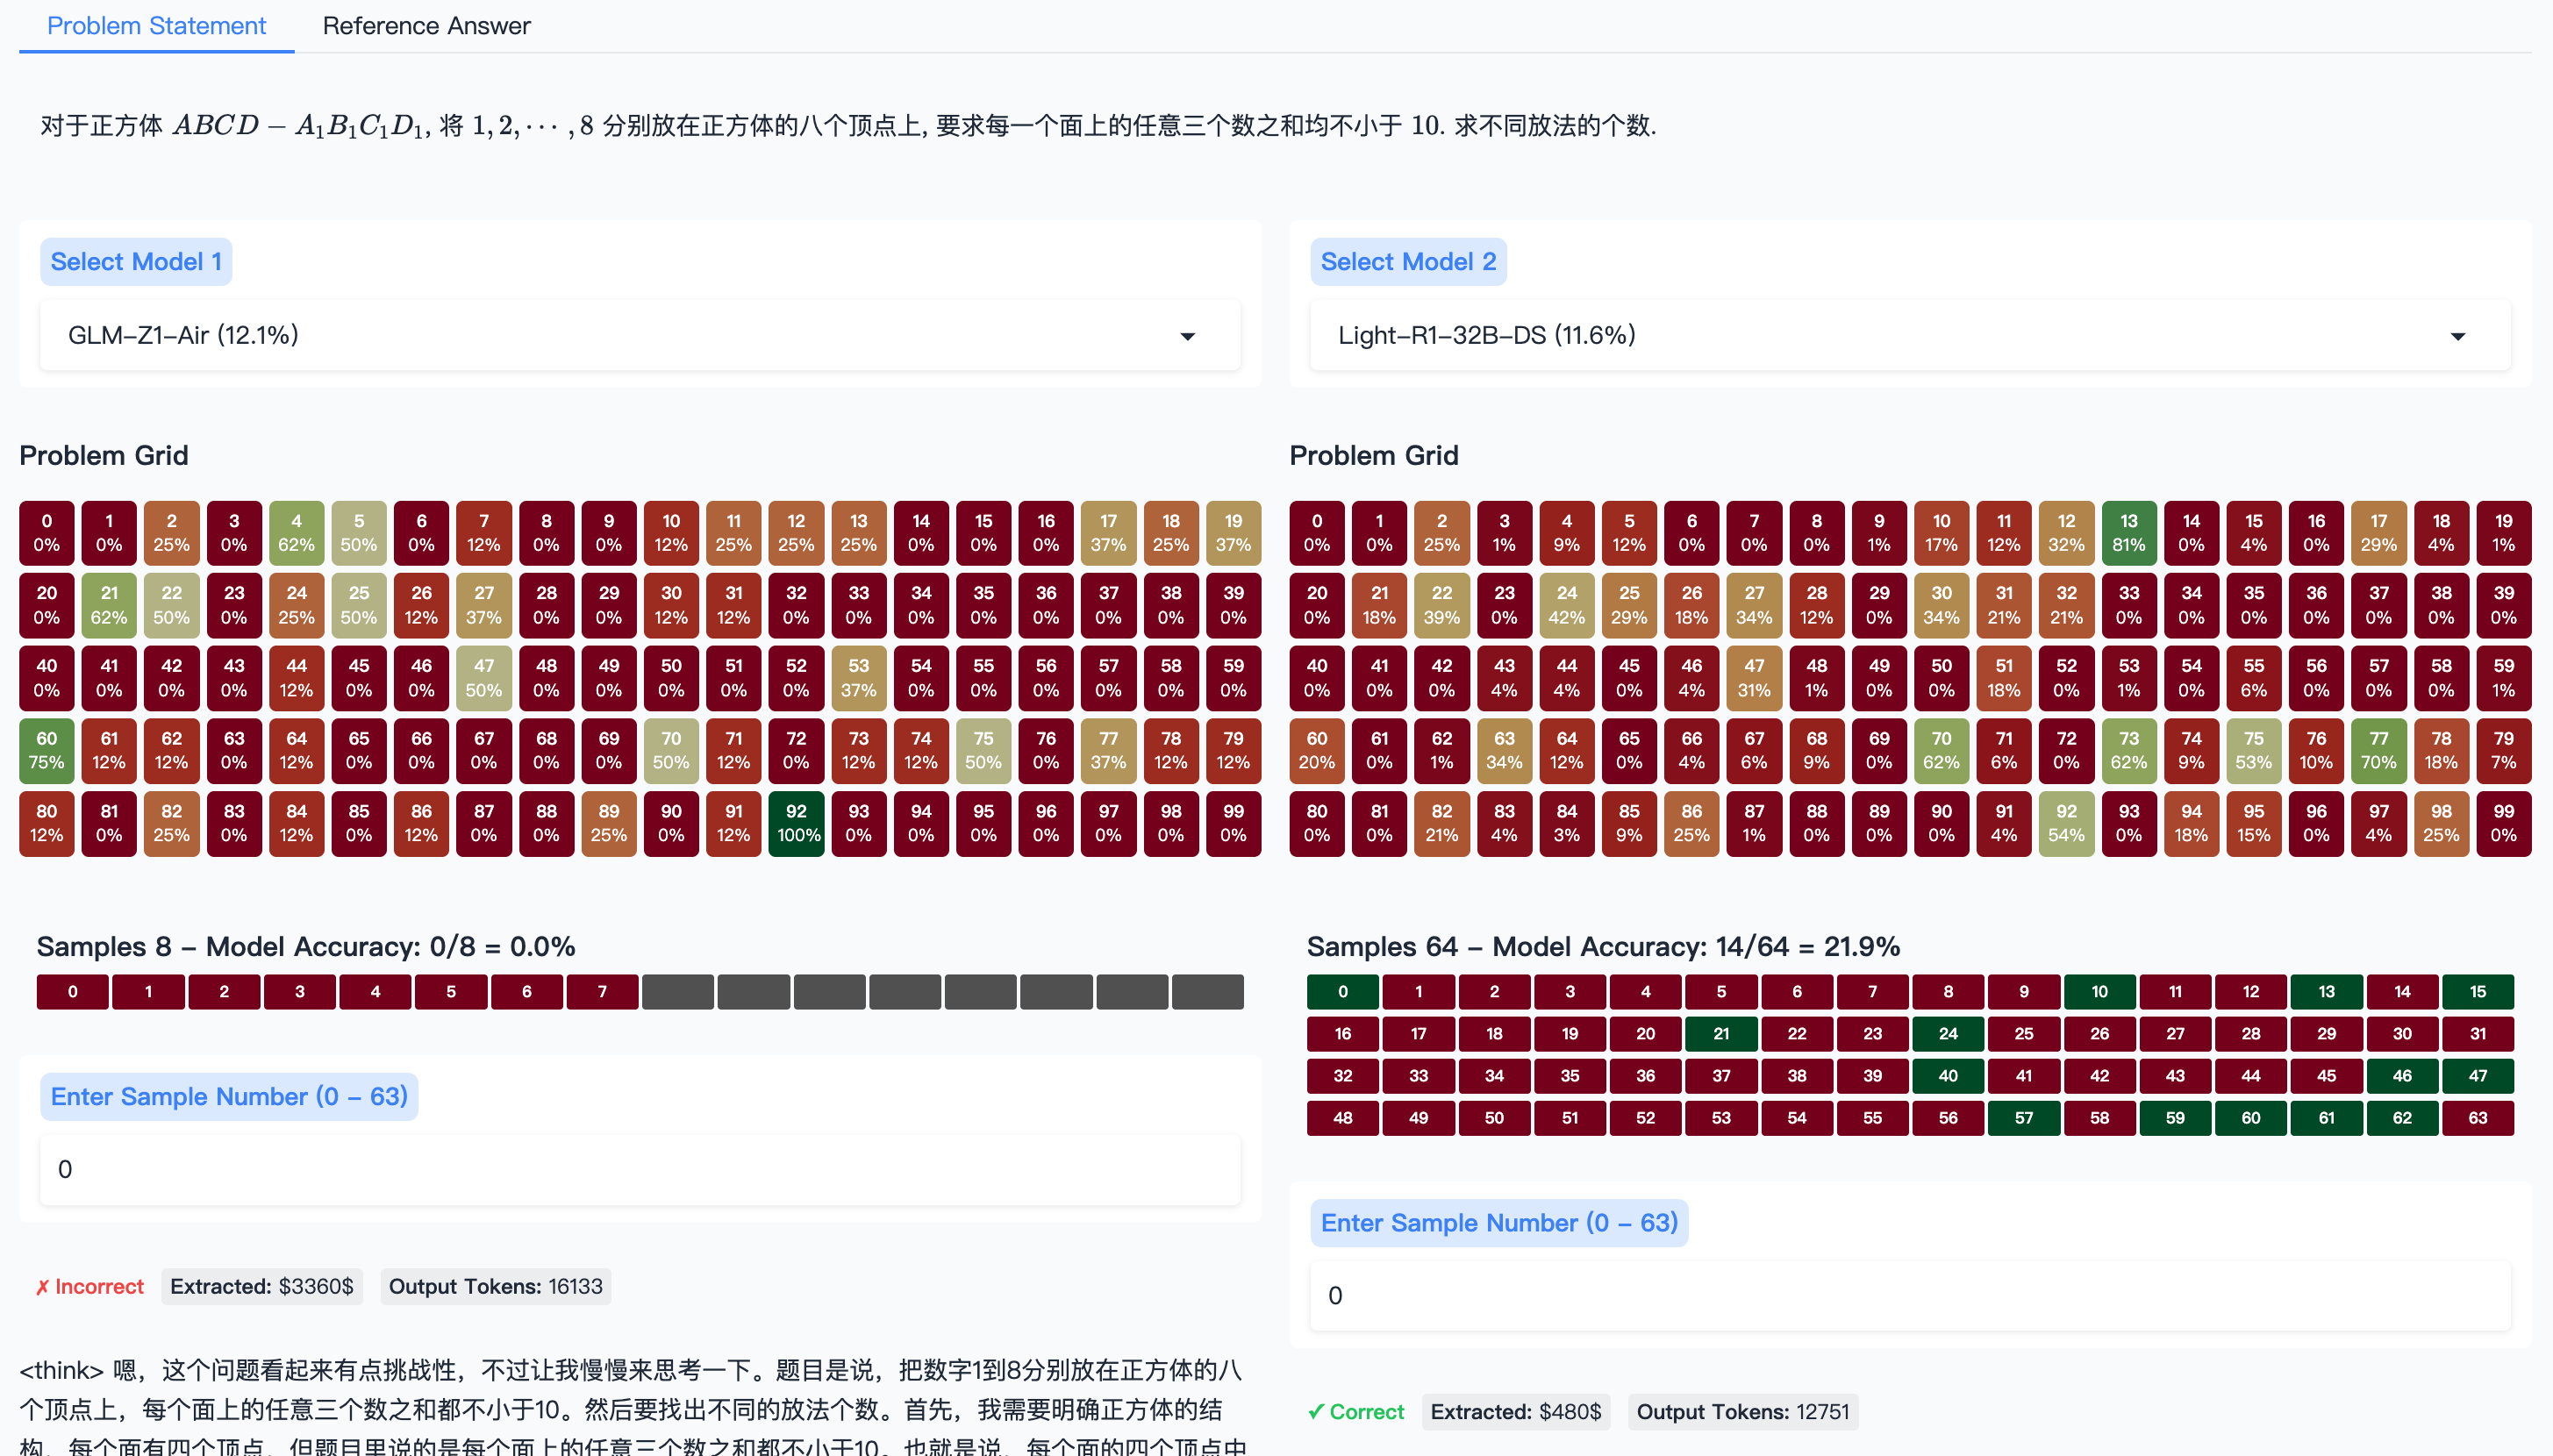
## Technical Document Extraction: AI Model Evaluation Interface
### Overview
The image displays a web-based interface for evaluating and comparing the performance of two AI models on a specific mathematical problem. The interface includes the problem statement, model selection dropdowns, visual performance grids ("Problem Grids"), sample accuracy summaries, and model output snippets. The primary language is Chinese, with some English UI elements.
### Components/Axes
**1. Header Section:**
* **Tabs:** "Problem Statement" (selected, blue underline) and "Reference Answer".
* **Problem Statement (Chinese):** "对于正方体 $ABCD - A_1B_1C_1D_1$, 将 $1, 2, \cdots, 8$ 分别放在正方体的八个顶点上, 要求每一个面上的任意三个数之和均不小于 $10$. 求不同放法的个数."
* **English Translation:** "For a cube $ABCD - A_1B_1C_1D_1$, place the numbers $1, 2, \cdots, 8$ on the eight vertices of the cube, with the requirement that the sum of any three numbers on each face is not less than $10$. Find the number of different placement methods."
**2. Model Selection:**
* **Left Panel:** "Select Model 1" dropdown showing "GLM-Z1-Air (12.1%)".
* **Right Panel:** "Select Model 2" dropdown showing "Light-R1-32B-DS (11.6%)".
* The percentages in parentheses likely represent an overall accuracy or performance metric for each model on a broader benchmark.
**3. Problem Grids (Two Identical Structures):**
* **Title:** "Problem Grid" (appears above both left and right grids).
* **Structure:** A 10x10 grid of cells, numbered 0 to 99 (reading left-to-right, top-to-bottom).
* **Cell Content:** Each cell contains a number (the index, 0-99) and a percentage value below it.
* **Color Coding:** Cells are colored based on the percentage value, creating a heatmap.
* **Dark Red / Maroon:** Very low percentages (e.g., 0%, 1%, 4%).
* **Brown / Tan:** Low to mid-range percentages (e.g., 12%, 18%, 25%, 37%).
* **Olive / Yellow-Green:** Mid to high percentages (e.g., 50%, 62%, 70%).
* **Dark Green:** Very high percentages (e.g., 81%, 100%).
* **Spatial Layout:** The grids are placed side-by-side for direct visual comparison. The left grid corresponds to Model 1, and the right grid to Model 2.
**4. Sample Accuracy & Output Sections:**
* **Left (Model 1):**
* **Title:** "Samples 8 – Model Accuracy: 0/8 = 0.0%"
* **Sample Bar:** A horizontal bar with 8 segments, all colored dark red, labeled 0 through 7.
* **Input Field:** "Enter Sample Number (0 – 63)" with a text box containing "0".
* **Output Status:** "✗ Incorrect" (in red).
* **Output Details:** "Extracted: $3360$", "Output Tokens: 16133".
* **Model Output Snippet (Chinese):** "<think> 嗯,这个问题看起来有点挑战性,不过让我慢慢来思考一下。题目是说,把数字1到8分别放在正方体的八个顶点上,每个面上的任意三个数之和都不小于10。然后要找出不同的放法个数。首先,我需要明确正方体的结构。每个面有四个顶点,但题目里说的是每个面上的任意三个数之和都不小于10。也就是说,每个面的四个顶点中..."
* **Partial English Translation:** "<think> Hmm, this problem looks a bit challenging, but let me think about it slowly. The problem states that we place the numbers 1 to 8 on the eight vertices of a cube, and the sum of any three numbers on each face is not less than 10. Then we need to find the number of different placement methods. First, I need to clarify the structure of a cube. Each face has four vertices, but the problem says the sum of any three numbers on each face is not less than 10. That is to say, among the four vertices of each face..."
* **Right (Model 2):**
* **Title:** "Samples 64 – Model Accuracy: 14/64 = 21.9%"
* **Sample Bar:** A horizontal bar with 64 segments. Segments are colored either dark red (incorrect) or dark green (correct). The green segments are at indices: 0, 10, 13, 15, 21, 24, 40, 46, 47, 57, 59, 60, 61, 62.
* **Input Field:** "Enter Sample Number (0 – 63)" with a text box containing "0".
* **Output Status:** "✓ Correct" (in green).
* **Output Details:** "Extracted: $480$", "Output Tokens: 12751".
### Detailed Analysis
**Problem Grid Data (Key Points):**
* **Left Grid (GLM-Z1-Air):** Shows a scattered pattern of performance. Notable high-performing cells (green/olive) include:
* Cell 4: 62%
* Cell 5: 50%
* Cell 21: 62%
* Cell 22: 50%
* Cell 60: 75%
* Cell 92: 100% (the only perfect score).
* The majority of cells are dark red (0%) or brown (12-37%).
* **Right Grid (Light-R1-32B-DS):** Shows a different performance distribution. Notable high-performing cells include:
* Cell 13: 81%
* Cell 24: 42%
* Cell 30: 34%
* Cell 70: 62%
* Cell 73: 62%
* Cell 77: 70%
* Cell 92: 54%
* This grid has fewer 0% cells but also fewer extremely high (75%+) cells compared to the left grid.
**Model Accuracy Comparison:**
* **Model 1 (GLM-Z1-Air):** Evaluated on 8 samples. Achieved 0 correct answers (0.0% accuracy). The extracted answer for sample 0 was "$3360$", which was marked incorrect.
* **Model 2 (Light-R1-32B-DS):** Evaluated on 64 samples. Achieved 14 correct answers (21.9% accuracy). The extracted answer for sample 0 was "$480$", which was marked correct.
### Key Observations
1. **Performance Discrepancy:** There is a stark contrast in accuracy between the two models on this specific problem (0% vs. 21.9%), despite their similar overall benchmark scores shown in the dropdowns (12.1% vs. 11.6%).
2. **Answer Divergence:** For the same sample input (Sample 0), the models produced vastly different numerical answers ($3360$ vs. $480$), with only the latter being correct.
3. **Grid Pattern Differences:** The heatmap grids reveal that the models have different strengths and weaknesses across the 100 problem variants or test cases. Model 1 has a few very high peaks (including a 100% score) but many valleys (0%). Model 2's performance is more distributed, with fewer perfect scores but a higher baseline of non-zero results.
4. **Sample Size Inequality:** The models were evaluated on different sample sizes (8 vs. 64), which makes a direct comparison of the "Model Accuracy" percentage somewhat misleading without considering the confidence interval.
### Interpretation
This interface is a diagnostic tool for analyzing AI model reasoning on a complex combinatorial geometry problem. The data suggests:
* **Problem Difficulty:** The mathematical problem is non-trivial, as evidenced by the low accuracy rates (0% and 21.9%) even for specialized models. The correct answer appears to be 480.
* **Model Capability:** Model 2 (Light-R1-32B-DS) demonstrates a significantly better grasp of this specific problem type than Model 1 (GLM-Z1-Air). Its higher accuracy and the correctness of its answer for the displayed sample indicate more robust reasoning for this constraint-satisfaction task.
* **Diagnostic Value of the Grid:** The "Problem Grid" is not showing accuracy on 100 different problems, but likely the model's confidence or success rate on 100 different *sub-problems, reasoning steps, or perturbed versions* of the main problem. The color-coded heatmap allows researchers to quickly identify which specific aspects of the problem (represented by cell indices) are challenging for each model. For instance, both models scored 0% on cell 0, but Model 2 scored 81% on cell 13 where Model 1 scored 0%.
* **Token Efficiency:** Model 2 achieved a correct answer using fewer output tokens (12751 vs. 16133) for the same sample, suggesting potentially more efficient reasoning.
In summary, the image captures a moment of comparative analysis where one model clearly outperforms another on a challenging mathematical reasoning task, with visual tools provided to drill down into the granular performance differences.
DECODING INTELLIGENCE...