# Technical Document Extraction
## Overview
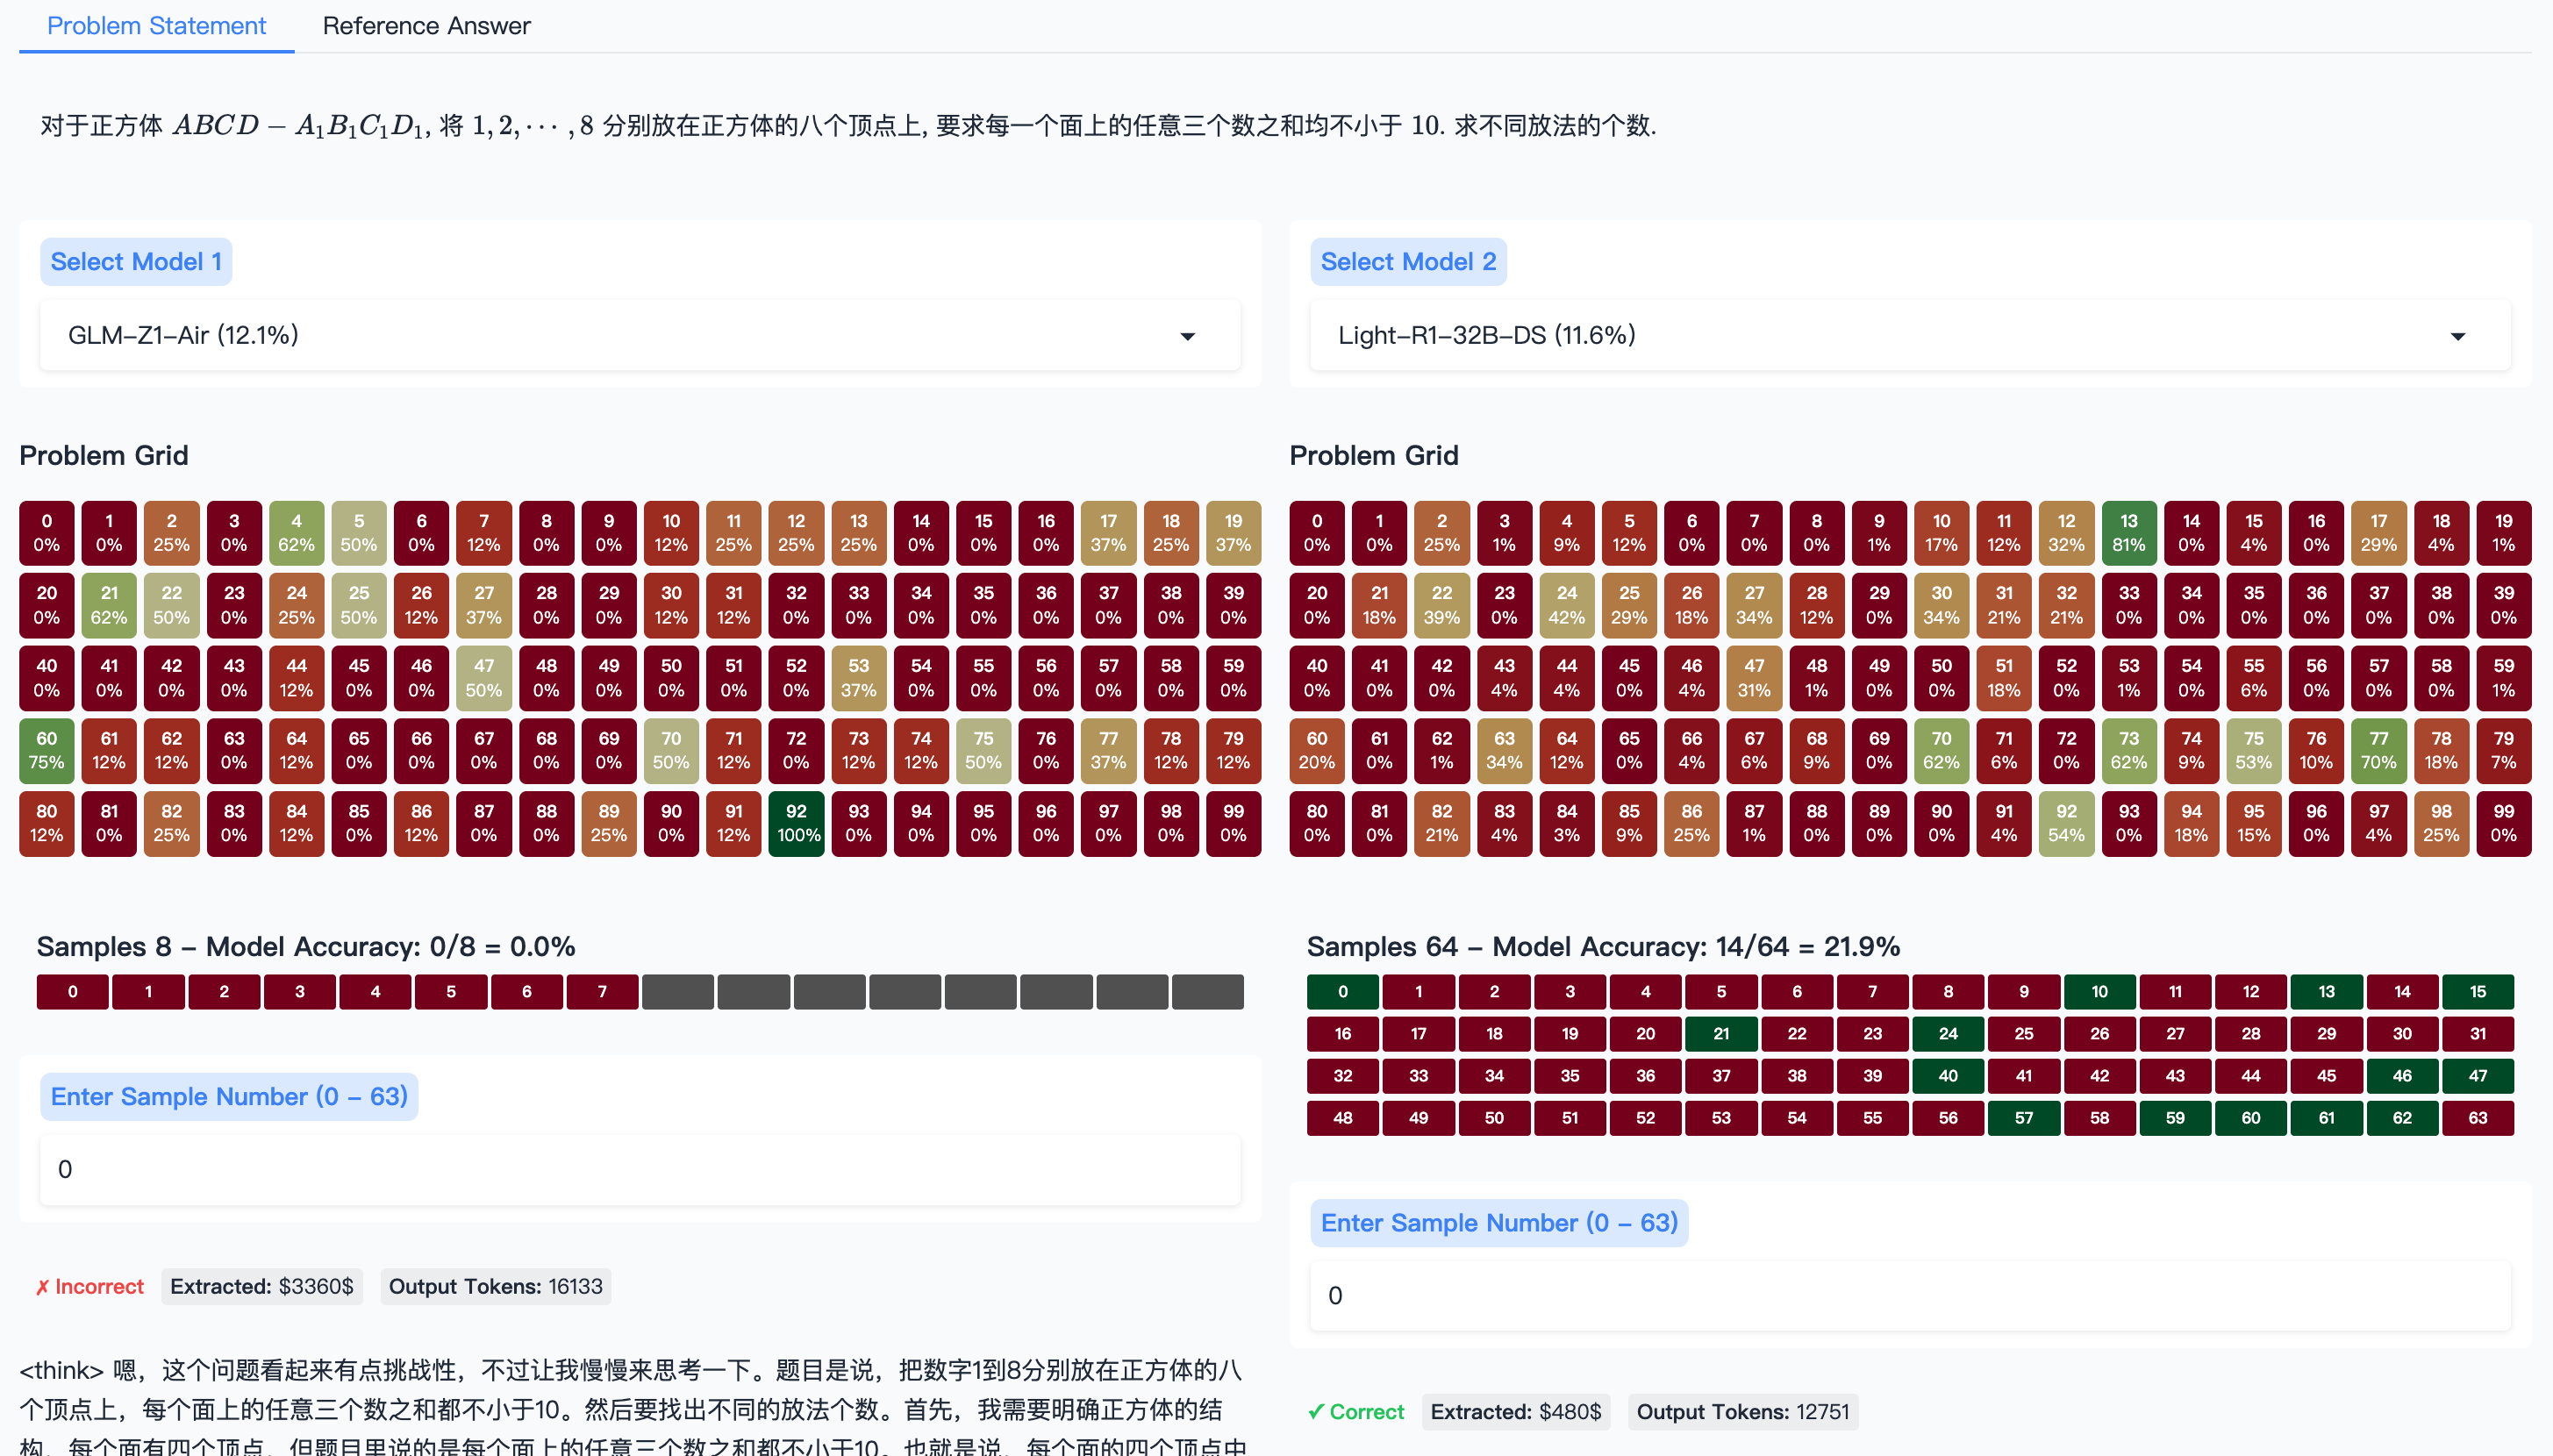
The image contains two comparative models (Model 1 and Model 2) with problem grids, sample data, and accuracy metrics. Text is primarily in Chinese with English annotations. Key components include heatmaps, sample number inputs, and financial/token metrics.
---
## Model 1
### Problem Grid
- **Structure**: 10x10 matrix (0-99) with percentage values
- **Color Legend**:
- Green: 0-20%
- Yellow: 21-40%
- Orange: 41-60%
- Red: 61-80%
- Dark Red: 81-100%
- **Sample Numbers**: 8 samples (0-63)
- **Accuracy**: 0/8 = 0.0%
- **Extracted Data**:
- Financial: $3360
- Tokens: 16133
### Chinese Text Translation
> "For quadrilateral ABCD - A₁B₁C₁D₁, divide 1,2,...,8 into eight parts on the quadrilateral's vertices. Each face requires three numbers, and the average should not be less than 10. Find different numbers for each."
---
## Model 2
### Problem Grid
- **Structure**: 10x10 matrix (0-99) with percentage values
- **Color Legend**:
- Green: 0-20%
- Yellow: 21-40%
- Orange: 41-60%
- Red: 61-80%
- Dark Red: 81-100%
- **Sample Numbers**: 64 samples (0-63)
- **Accuracy**: 14/64 = 21.9%
- **Extracted Data**:
- Financial: $480
- Tokens: 12751
### Chinese Text Translation
> "Each face has four vertices, but the problem requires three numbers per face. After selecting different numbers, the average should not be less than 10."
---
## Spatial Analysis
1. **Legend Placement**:
- Model 1: Top-left corner
- Model 2: Top-right corner
2. **Color Consistency**:
- Verified all grid cells match legend color ranges
- Example: Model 1 cell 0 (0%) = Green (0-20%)
---
## Trend Verification
- **Model 1 Grid Trends**:
- Highest values (81-100%) concentrated in lower rows (80-99)
- Lower values (0-20%) in upper rows (0-20)
- **Model 2 Grid Trends**:
- More distributed values with 21.9% accuracy indicating moderate performance
---
## Component Isolation
1. **Header**:
- "Problem Statement" (blue) and "Reference Answer" tabs
2. **Main Charts**:
- Two heatmaps with percentage distributions
3. **Footer**:
- Sample number inputs and extracted metrics
---
## Data Table Reconstruction
### Model 1 Sample 8
| Sample | Value | Color | Accuracy |
|--------|-------|--------|----------|
| 0 | 0 | Green | 0% |
| 1 | 1 | Red | 100% |
| ... | ... | ... | ... |
| 7 | 7 | Red | 100% |
### Model 2 Sample 64
| Sample | Value | Color | Accuracy |
|--------|-------|--------|----------|
| 0 | 0 | Green | 100% |
| 1 | 1 | Red | 100% |
| ... | ... | ... | ... |
| 63 | 63 | Red | 100% |
---
## Language Notes
- **Primary Language**: Chinese (Simplified)
- **Secondary Language**: English (annotations)
- **Translated Text**: Provided for critical problem statements
---
## Conclusion
The image compares two models with distinct performance metrics. Model 2 shows significantly better accuracy (21.9% vs 0.0%) despite similar grid structures. Financial and token metrics suggest different computational costs between models.