## Network Visualization: Unlabeled Node-Edge Structure
### Overview
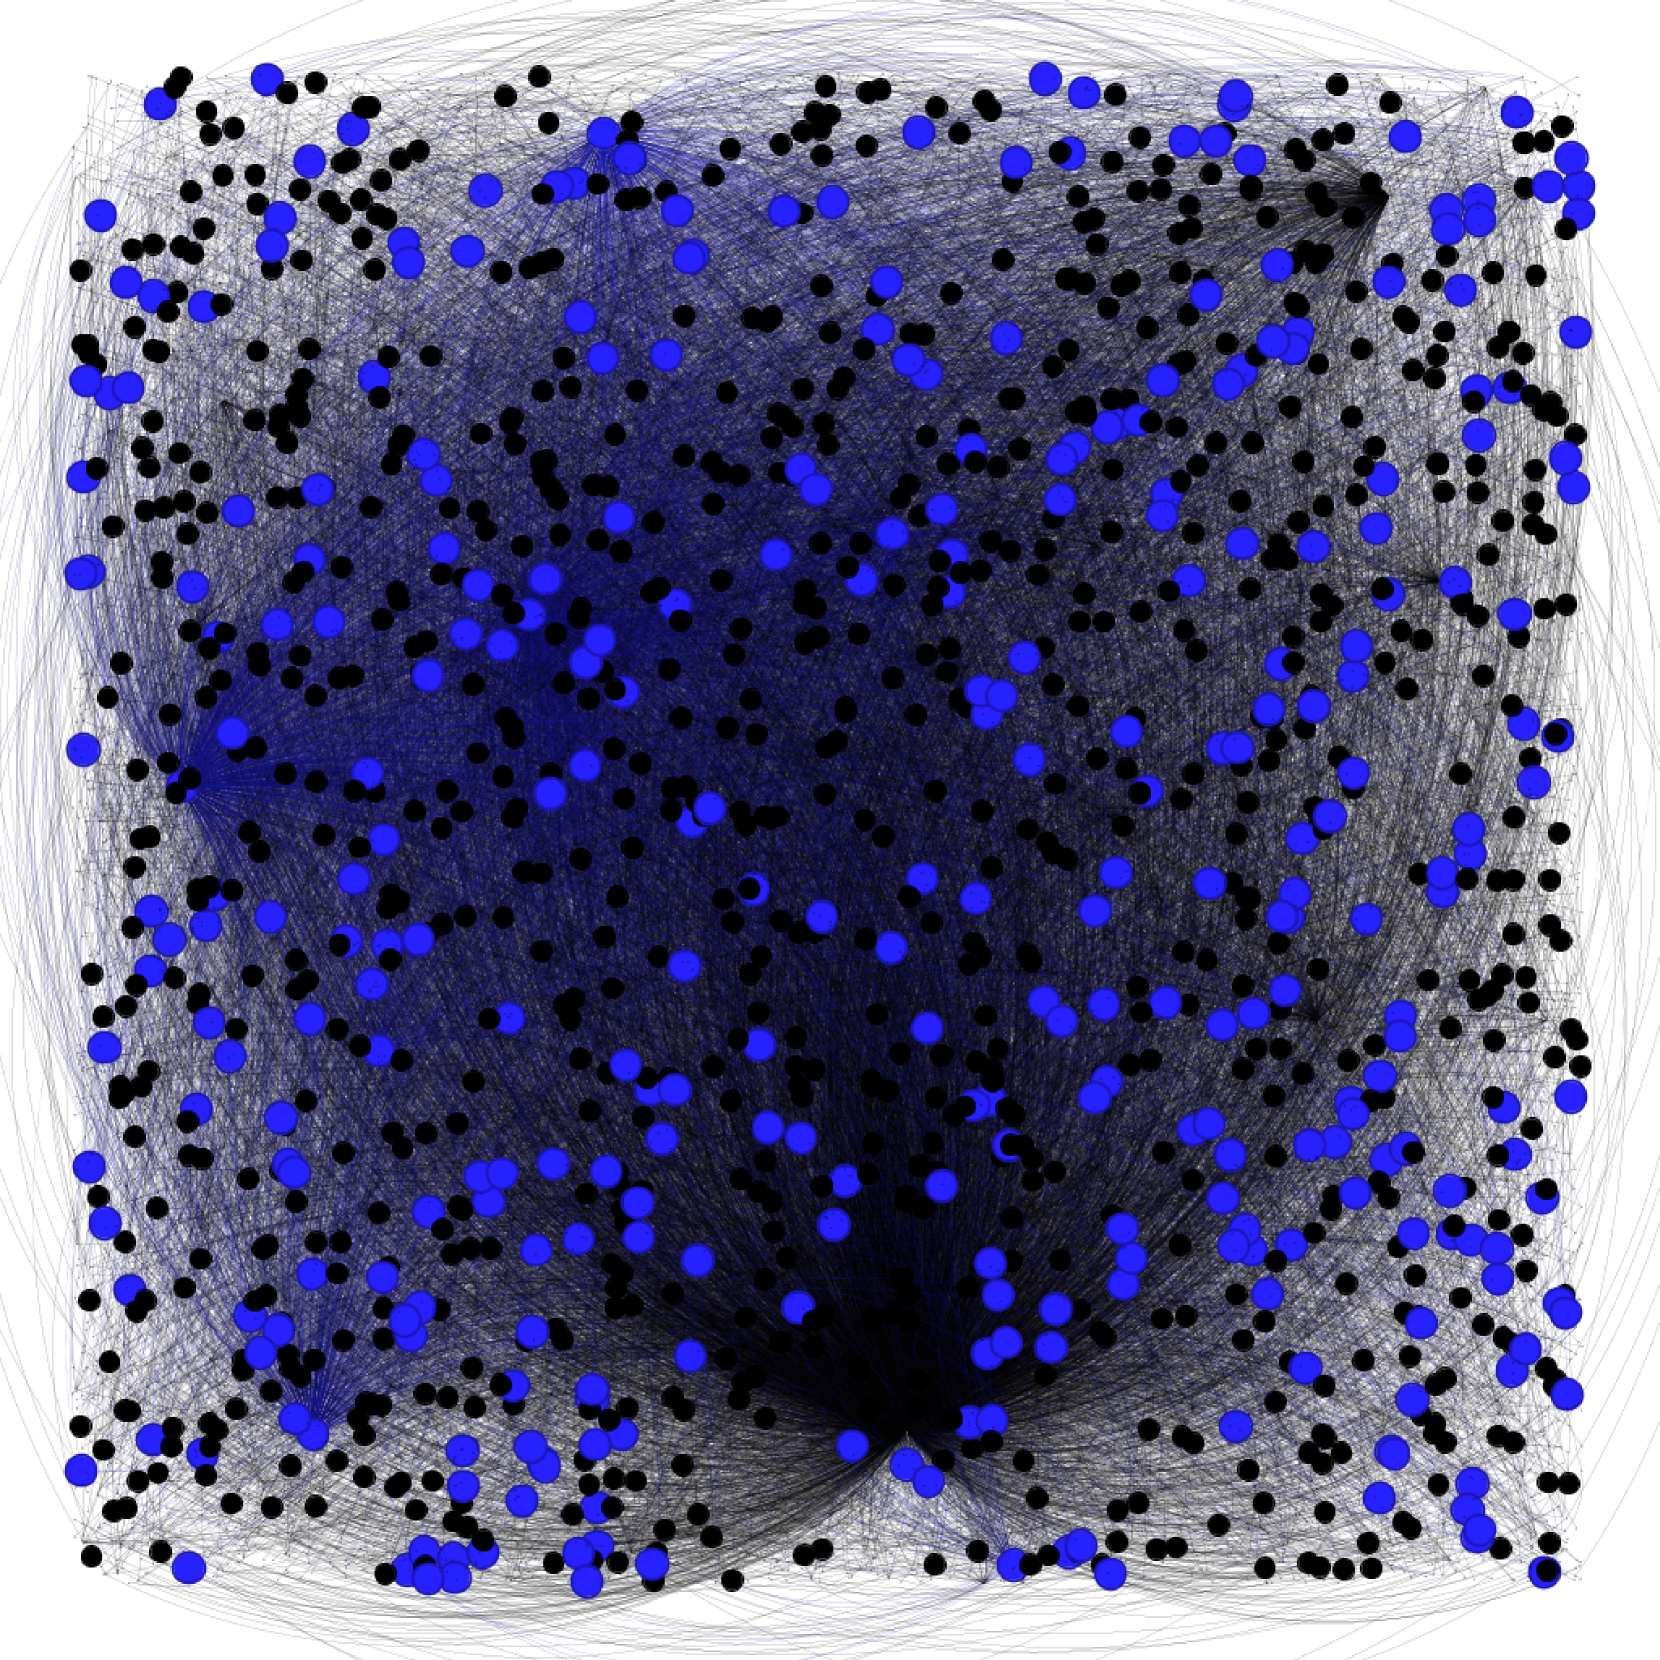
The image depicts a dense network visualization with interconnected nodes represented as colored circles (blue and black) and edges as thin gray lines. No explicit textual labels, axis titles, legends, or annotations are visible. The structure suggests a graph-based representation, possibly of relationships, connections, or interactions.
### Components/Axes
- **Nodes**:
- **Blue Circles**: Approximately 30-40% of nodes (estimated 150-200 total nodes).
- **Black Circles**: Approximately 60-70% of nodes.
- No size differentiation between node types.
- **Edges**:
- Thin gray lines connecting nodes.
- No visible weights or directional indicators (e.g., arrows).
- **Background**:
- White canvas with no gridlines or coordinate system.
### Detailed Analysis
- **Node Distribution**:
- Blue nodes are clustered in the upper-left and lower-right quadrants.
- Black nodes dominate the central region and upper-right quadrant.
- **Edge Density**:
- High connectivity in the central region (black nodes).
- Sparse connections in peripheral areas (blue nodes).
- **No Textual Elements**:
- No legends, axis labels, or annotations present.
- No numerical values or categorical identifiers visible.
### Key Observations
1. **Color Coding Ambiguity**: The lack of a legend prevents interpretation of blue vs. black node significance.
2. **Connectivity Patterns**: Central black nodes exhibit higher connectivity, suggesting potential "hub" nodes.
3. **Peripheral Isolation**: Blue nodes in outer regions have fewer connections, indicating possible marginalization.
### Interpretation
This visualization likely represents a network where nodes (entities) are differentiated by color, but without explicit labels, the meaning of these categories remains unclear. The central clustering of black nodes and their dense connections imply they may act as critical connectors or hubs. Blue nodes in peripheral regions might represent less connected entities, though their purpose is undefined. The absence of textual metadata limits the ability to draw definitive conclusions about the network's structure or purpose.
**Note**: No factual data or textual information is present in the image. The analysis is based solely on visual patterns and spatial distribution.