## Network Diagram: Node Connectivity
### Overview
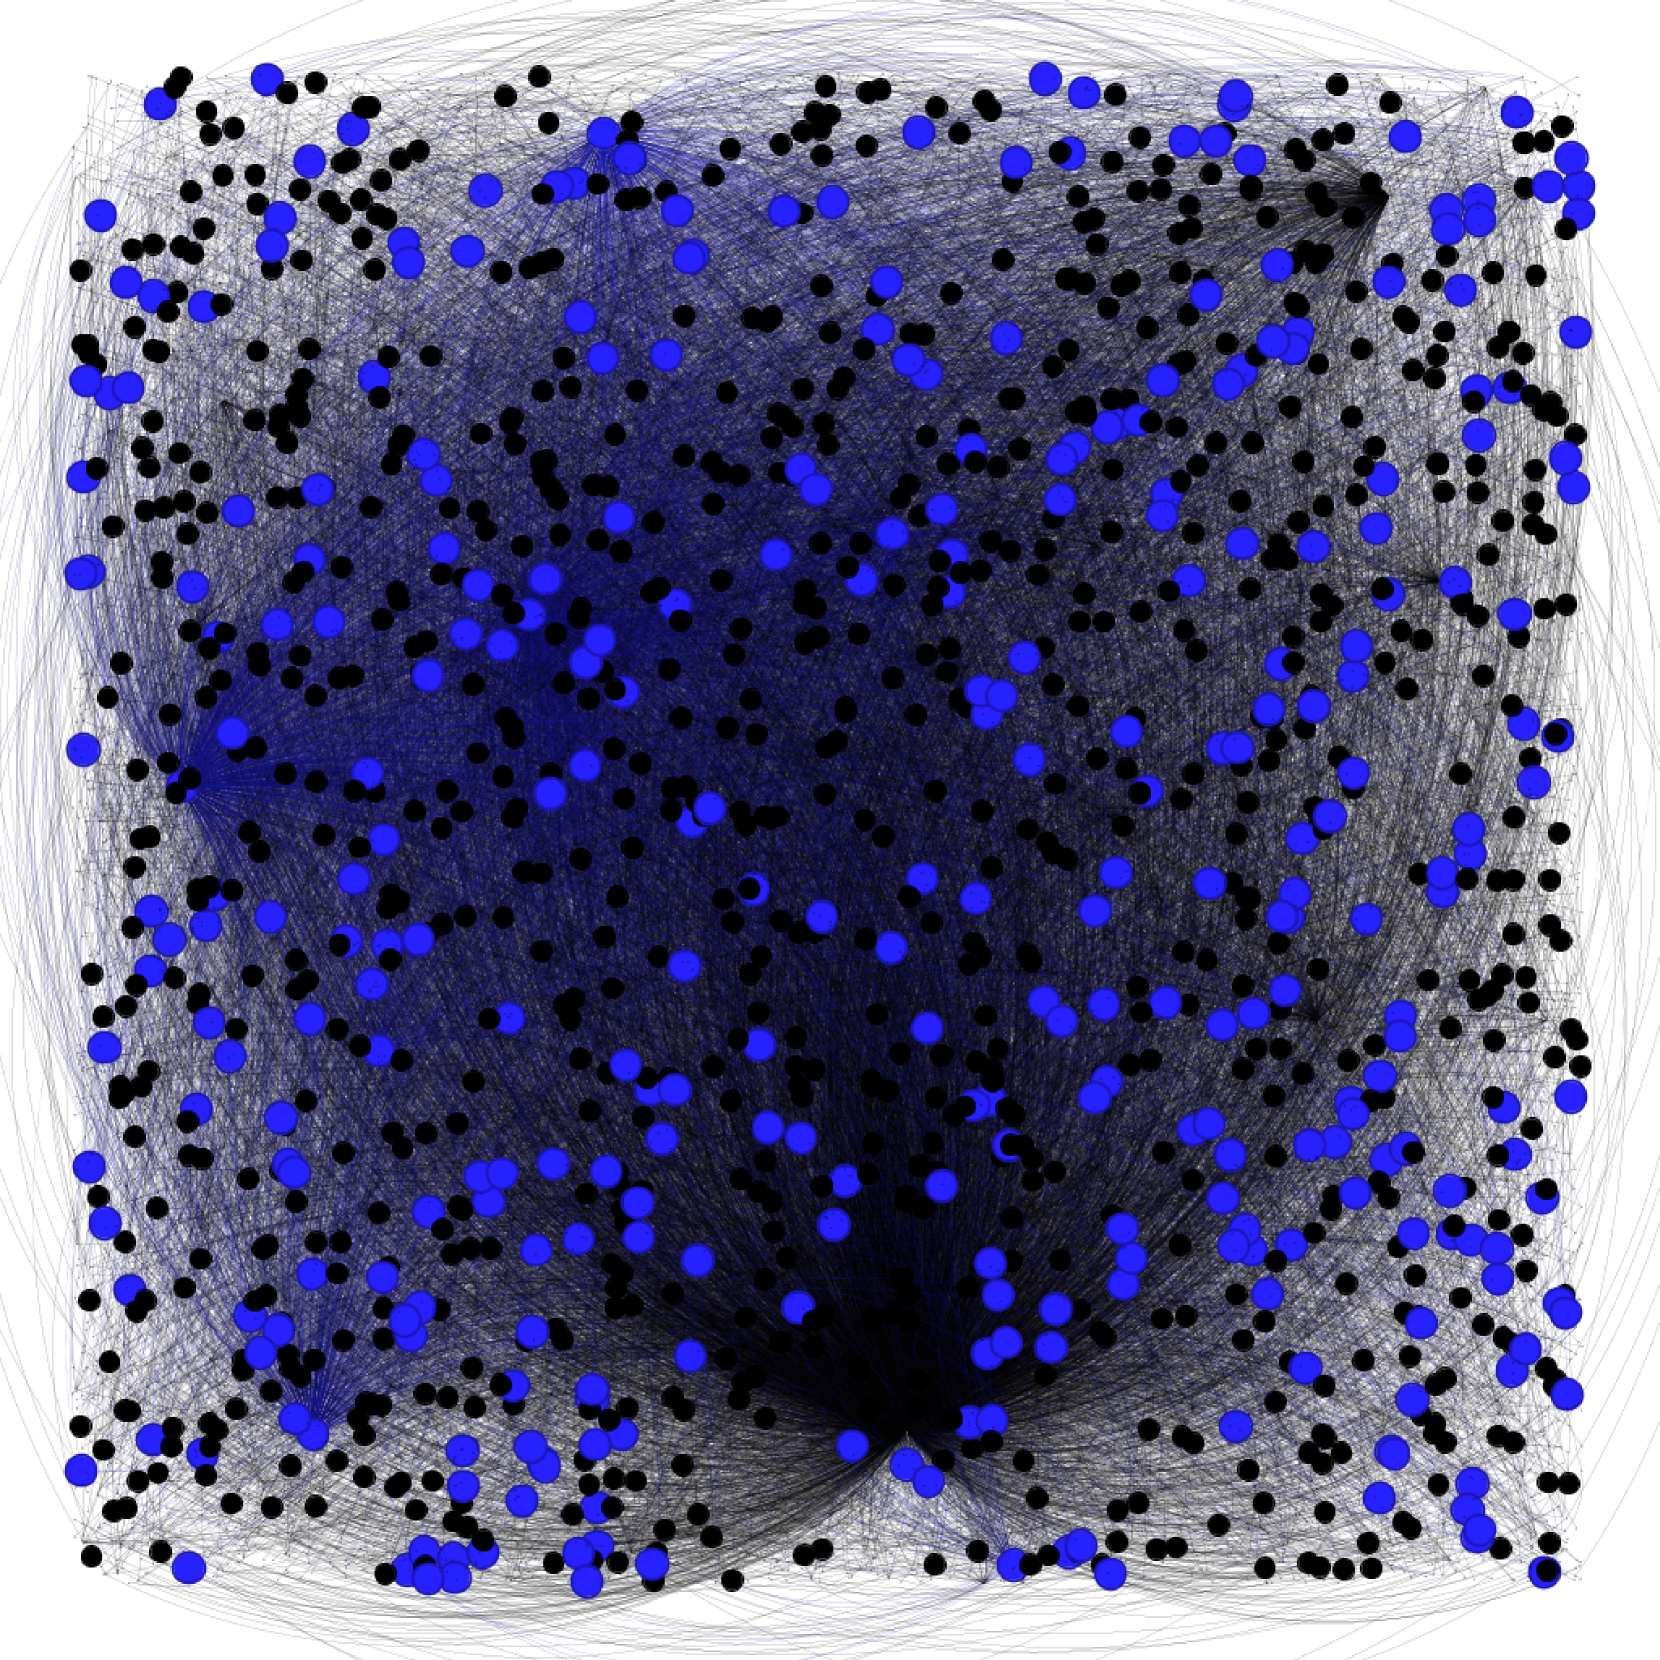
The image is a network diagram displaying interconnected nodes. The nodes are represented by blue and black circles, and the connections between them are shown as thin, gray lines. The diagram appears to be a visualization of a complex network, with a higher density of connections in the central region.
### Components/Axes
* **Nodes:** Represented by blue and black circles. The blue circles are larger than the black circles.
* **Edges:** Represented by thin, gray lines connecting the nodes.
* **Layout:** The nodes are arranged in a roughly square shape, with a higher density of nodes and edges in the center.
### Detailed Analysis or ### Content Details
* **Node Distribution:** The nodes are distributed throughout the diagram, with a higher concentration in the central area. The blue nodes appear to be more sparsely distributed than the black nodes.
* **Edge Density:** The density of edges is highest in the center of the diagram, indicating a higher degree of connectivity between nodes in this region. The edges appear to radiate outwards from the center.
* **Node Colors:** There are two distinct node colors: blue and black. The significance of these colors is not explicitly stated in the image.
* **Node Size:** The blue nodes are larger than the black nodes. The significance of the size difference is not explicitly stated in the image.
* **Edge Curvature:** The edges are curved, suggesting a force-directed layout algorithm was used to generate the diagram.
### Key Observations
* The network exhibits a core-periphery structure, with a densely connected core and a more sparsely connected periphery.
* The blue nodes may represent a different type of node or a node with different properties than the black nodes.
* The size of the blue nodes may indicate a higher degree of importance or influence within the network.
### Interpretation
The network diagram likely represents a complex system with interconnected entities. The blue and black nodes could represent different types of entities, and the edges represent the relationships between them. The higher density of connections in the center suggests that this region is a hub of activity or interaction. Without additional context, it is difficult to determine the specific meaning of the diagram, but it provides a visual representation of the network's structure and connectivity. The difference in size between the blue and black nodes could indicate a difference in importance or influence within the network.