\n
## Network Graph: Relationship Visualization
### Overview
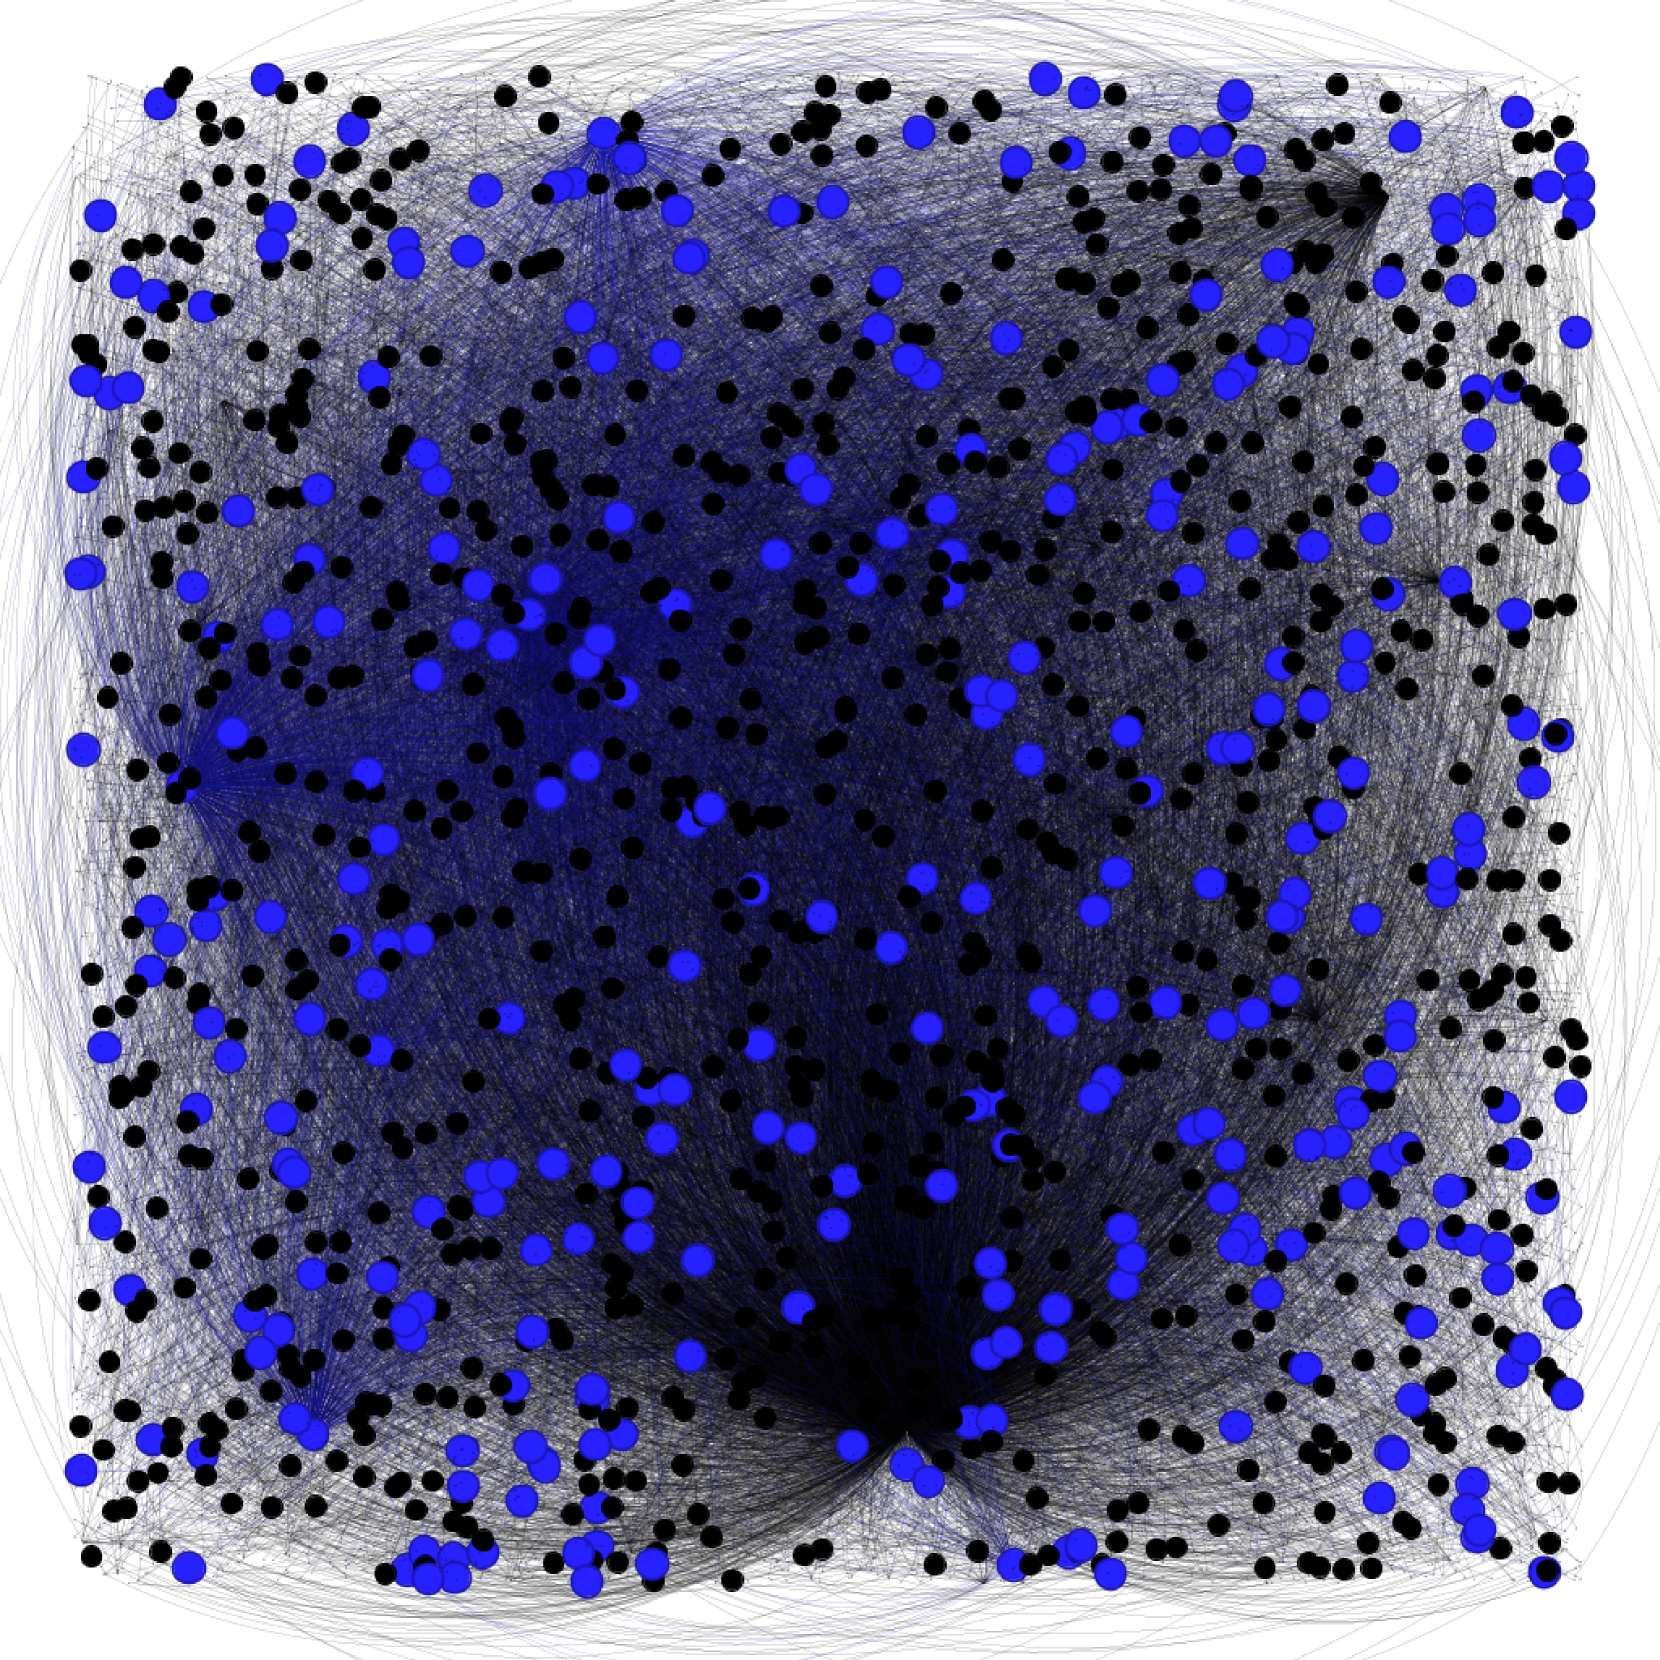
The image depicts a network graph, visually representing relationships between nodes. The nodes are represented as circles, varying in size and color. The connections between nodes are shown as thin, grey lines. The graph exhibits a central, densely connected cluster with radiating connections to more sparsely connected nodes. There are no explicit axes or labels.
### Components/Axes
There are no explicit axes or labels present in the image. The graph consists of:
* **Nodes:** Represented by circles, colored either black or blue, and varying in size.
* **Edges:** Represented by thin, grey lines connecting the nodes.
* **Background:** A gradient background, transitioning from dark blue in the center to lighter shades towards the edges.
### Detailed Analysis or Content Details
The graph is dominated by a central cluster of nodes. The density of connections is highest in this central region.
* **Node Color:** The nodes are predominantly either black or blue. The blue nodes appear to be more prevalent in the periphery of the graph, while black nodes are concentrated in the central cluster.
* **Node Size:** Node size varies. Larger nodes appear to be more central within clusters, suggesting higher connectivity or importance.
* **Edge Density:** The central region exhibits a very high edge density, meaning many nodes are connected to multiple other nodes. As you move outwards from the center, the edge density decreases significantly.
* **Central Cluster:** The central cluster is characterized by a high concentration of black nodes and a dense network of connections. The connections radiate outwards from this cluster.
* **Peripheral Nodes:** The periphery of the graph contains a mix of blue and black nodes, but with fewer connections compared to the central cluster. The blue nodes are more prominent in the periphery.
* **Gradient Background:** The gradient background, darker in the center and lighter towards the edges, visually emphasizes the central cluster.
It is impossible to provide precise numerical data without specific node identifiers or edge weights. However, we can describe the distribution:
* Approximately 60-70% of the nodes appear to be black.
* Approximately 30-40% of the nodes appear to be blue.
* The largest nodes have a diameter approximately 3-4 times larger than the smallest nodes.
* The edge density in the central cluster is estimated to be 5-10 times higher than in the periphery.
### Key Observations
* The graph exhibits a clear core-periphery structure.
* Black nodes are more central and highly connected.
* Blue nodes are more peripheral and less connected.
* Node size correlates with connectivity.
* The gradient background highlights the central cluster.
### Interpretation
This network graph likely represents a system of relationships where certain entities (represented by black nodes) are more central and influential than others (represented by blue nodes). The high connectivity within the central cluster suggests strong interactions and dependencies among these core entities. The radiating connections indicate that these core entities influence or are connected to more peripheral entities.
The varying node sizes suggest that some entities within the network have greater importance or influence than others. The gradient background visually reinforces this hierarchy, emphasizing the central cluster as the focal point of the network.
The graph could represent a social network, a biological network, a communication network, or any other system where relationships between entities are important. Without additional context, it is difficult to determine the specific meaning of the nodes and edges. However, the core-periphery structure and the varying node sizes suggest a hierarchical system with a clear power dynamic. The prevalence of black nodes in the center could indicate a dominant group or a central authority. The blue nodes on the periphery might represent less influential or more isolated entities.
The lack of labels or axes makes it difficult to draw definitive conclusions. Further analysis would require additional information about the entities represented by the nodes and the nature of the relationships represented by the edges.