# Technical Document Extraction: Scatter Plot Analysis
## 1. Labels and Axis Titles
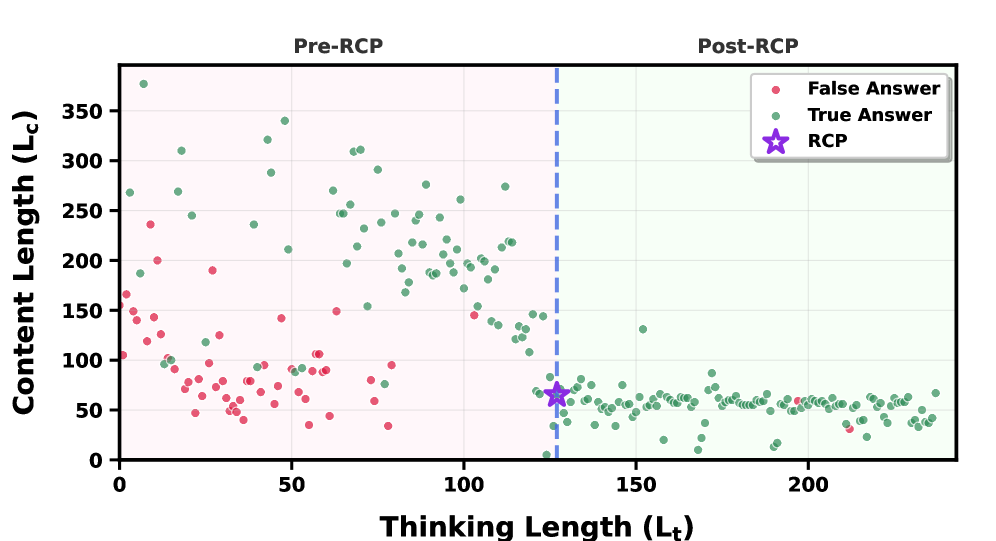
- **X-Axis**: "Thinking Length (Lt)"
- **Y-Axis**: "Content Length (Lc)"
- **Title**: Split into two regions:
- **Left Region**: "Pre-RCP"
- **Right Region**: "Post-RCP"
- **Boundary Line**: Vertical dashed blue line at **Lt = 120**
## 2. Legend
- **Location**: Top-right corner of the plot
- **Entries**:
- **Red Circles**: "False Answer"
- **Green Circles**: "True Answer"
- **Purple Star**: "RCP"
## 3. Data Trends and Points
### Pre-RCP Region (Lt < 120)
- **False Answers (Red)**:
- Clustered primarily in the lower-left quadrant (Lt: 0–100, Lc: 0–200).
- Density decreases as Lt increases.
- **True Answers (Green)**:
- Spread across the entire Pre-RCP region (Lt: 0–120, Lc: 50–350).
- Higher concentration in the upper-middle range (Lt: 50–100, Lc: 150–250).
### Post-RCP Region (Lt ≥ 120)
- **False Answers (Red)**:
- **Absent** in this region.
- **True Answers (Green)**:
- Concentrated in the lower-right quadrant (Lt: 120–200, Lc: 50–100).
- Density decreases as Lt increases beyond 150.
### RCP (Purple Star)
- **Position**: Exactly at **(Lt = 120, Lc = 60)**.
- **Significance**: Marks the threshold between Pre-RCP and Post-RCP regions.
## 4. Spatial Grounding and Color Verification
- **Legend Colors Match Data Points**:
- Red = False Answers (confirmed in Pre-RCP).
- Green = True Answers (confirmed in both regions).
- Purple Star = RCP (confirmed at (120, 60)).
## 5. Trend Verification
- **Pre-RCP**:
- False Answers dominate lower Lt/Lc values.
- True Answers show variability but no clear trend.
- **Post-RCP**:
- True Answers shift to higher Lt and lower Lc, indicating a clear optimization post-RCP.
## 6. Component Isolation
- **Header**: Title split by the blue dashed line.
- **Main Chart**:
- **Pre-RCP**: Mixed red/green points.
- **Post-RCP**: Exclusively green points.
- **Footer**: Legend and axis labels.
## 7. Key Observations
- The RCP (purple star) acts as a decision boundary.
- Post-RCP, only True Answers remain, suggesting RCP filters out False Answers.
- True Answers in Post-RCP cluster around **Lt = 120–150** and **Lc = 50–100**, indicating optimized performance.
## 8. Missing Elements
- No embedded text blocks, data tables, or heatmaps present.
- No non-English text detected.