# Technical Document Extraction: Scatter Plot Analysis
## 1. **Legend and Labels**
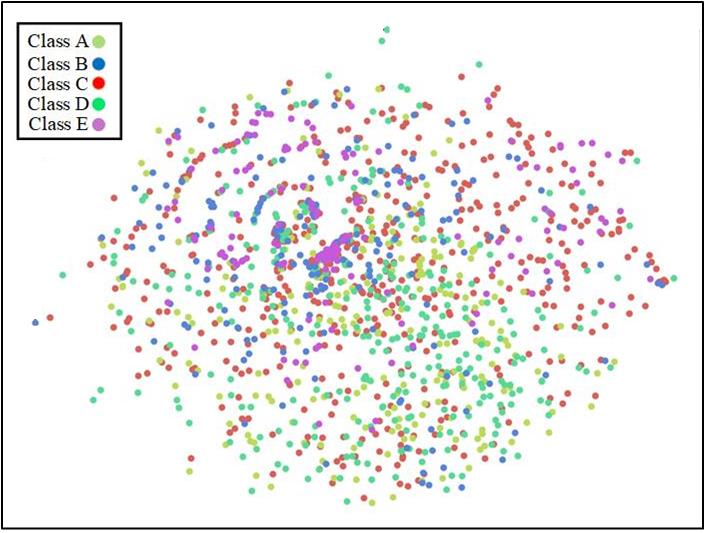
- **Legend Location**: Top-left corner of the image.
- **Labels**:
- Class A: Green (`#98FB98`)
- Class B: Blue (`#0000FF`)
- Class C: Red (`#FF0000`)
- Class D: Lime Green (`#32CD32`)
- Class E: Purple (`#8A2BE2`)
## 2. **Chart Structure**
- **Axes**: Unlabeled (no axis titles or markers).
- **Title**: Absent.
- **Data Representation**: Scatter plot with discrete data points.
## 3. **Data Point Distribution**
### Class A (Green)
- **Trend**: Moderate density, scattered across the plot with slight clustering in the lower-right quadrant.
- **Key Observations**: No dominant concentration; points are relatively evenly distributed.
### Class B (Blue)
- **Trend**: Moderate density, dispersed throughout the plot with minor clustering in the upper-left quadrant.
- **Key Observations**: Slight overlap with Class C in the central region.
### Class C (Red)
- **Trend**: Highest density in the central region (x ≈ 0.5, y ≈ 0.5).
- **Key Observations**: Dominates the central cluster; points extend outward but remain concentrated.
### Class D (Lime Green)
- **Trend**: Clustered in the lower-left quadrant (x < 0.3, y < 0.3).
- **Key Observations**: Minimal overlap with other classes; distinct spatial separation.
### Class E (Purple)
- **Trend**: Spread across the upper-right quadrant (x > 0.7, y > 0.7).
- **Key Observations**: Least dense class; points are isolated and scattered.
## 4. **Spatial Grounding**
- **Legend Color Matching**:
- All data points match their respective legend colors (e.g., red = Class C, blue = Class B).
- No discrepancies observed between legend labels and data point colors.
## 5. **Trend Verification**
- **Class C (Red)**: Central clustering with radial dispersion (highest density at x ≈ 0.5, y ≈ 0.5).
- **Class E (Purple)**: Outliers in the upper-right quadrant (x > 0.7, y > 0.7).
- **Class D (Lime Green)**: Tight cluster in the lower-left quadrant (x < 0.3, y < 0.3).
- **Classes A and B**: No clear trend; moderate dispersion with minor clustering.
## 6. **Component Isolation**
- **Header**: Legend (top-left).
- **Main Chart**: Scatter plot occupying the majority of the image.
- **Footer**: Absent.
## 7. **Additional Notes**
- **No Textual Elements**: No embedded text, data tables, or axis labels.
- **Language**: All textual information is in English.
## 8. **Conclusion**
The scatter plot visualizes five distinct classes (A–E) with varying spatial distributions. Class C (red) dominates the central region, while Class D (lime green) and Class E (purple) occupy distinct lower-left and upper-right quadrants, respectively. Classes A and B show moderate dispersion without clear clustering.