## Line Chart: Test AUROC vs. Layer Index
### Overview
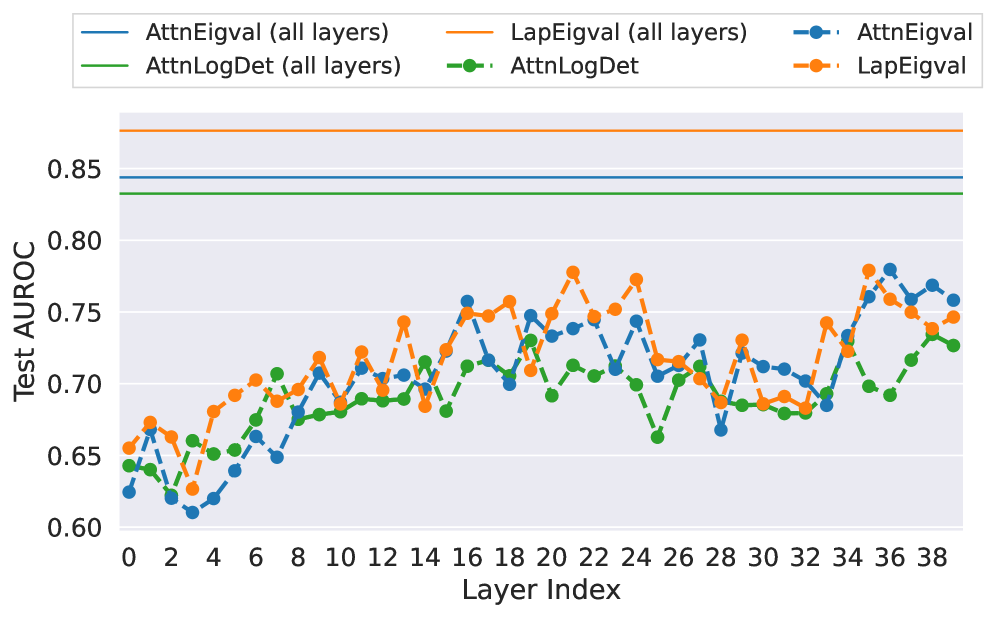
The image is a line chart comparing the Test AUROC (Area Under the Receiver Operating Characteristic curve) performance across different layers of a model, using different methods: AttnEigval, LapEigval, and AttnLogDet. The chart displays the performance of these methods across individual layers and also shows the performance of AttnEigval (all layers), LapEigval (all layers), and AttnLogDet (all layers) as horizontal lines.
### Components/Axes
* **X-axis:** Layer Index, ranging from 0 to 38 in increments of 2.
* **Y-axis:** Test AUROC, ranging from 0.60 to 0.85 in increments of 0.05.
* **Legend (Top-Left):**
* Blue solid line: AttnEigval (all layers)
* Green solid line: AttnLogDet (all layers)
* Orange solid line: LapEigval (all layers)
* Blue dashed line with circle markers: AttnEigval
* Green dashed line with circle markers: AttnLogDet
* Orange dashed line with circle markers: LapEigval
### Detailed Analysis
* **AttnEigval (all layers):** A solid blue horizontal line at approximately 0.845.
* **AttnLogDet (all layers):** A solid green horizontal line at approximately 0.83.
* **LapEigval (all layers):** A solid orange horizontal line at approximately 0.87.
* **AttnEigval:** (Dashed blue line with circle markers) Starts at approximately 0.66 at Layer Index 0, dips to 0.61 at Layer Index 4, then generally increases with fluctuations, reaching around 0.78 at Layer Index 38.
* **AttnLogDet:** (Dashed green line with circle markers) Starts at approximately 0.64 at Layer Index 0, increases to 0.70 at Layer Index 6, fluctuates, and ends at approximately 0.73 at Layer Index 38.
* **LapEigval:** (Dashed orange line with circle markers) Starts at approximately 0.67 at Layer Index 0, dips to 0.62 at Layer Index 4, then generally increases with fluctuations, reaching around 0.75 at Layer Index 38.
### Key Observations
* The "all layers" versions of AttnEigval, AttnLogDet, and LapEigval provide a consistent AUROC score across all layers, represented by horizontal lines.
* The individual layer performance (AttnEigval, AttnLogDet, and LapEigval) fluctuates across different layers.
* LapEigval (all layers) consistently shows the highest AUROC score, followed by AttnEigval (all layers) and then AttnLogDet (all layers).
* The individual layer performances of AttnEigval, AttnLogDet, and LapEigval are generally lower than their "all layers" counterparts.
### Interpretation
The chart compares the performance of different methods (AttnEigval, LapEigval, and AttnLogDet) for evaluating a model's performance across different layers. The "all layers" versions represent a baseline or aggregate performance, while the individual layer performances show how the model behaves at each specific layer. The higher AUROC scores for the "all layers" versions suggest that aggregating information across all layers leads to better overall performance compared to relying on individual layers. The fluctuations in individual layer performance indicate that some layers might be more informative or contribute more to the model's decision-making process than others. LapEigval (all layers) consistently outperforms the other methods, suggesting it might be a more effective approach for this particular model or task.