## Line Chart: Test AUC-ROC Across Layer Indices
### Overview
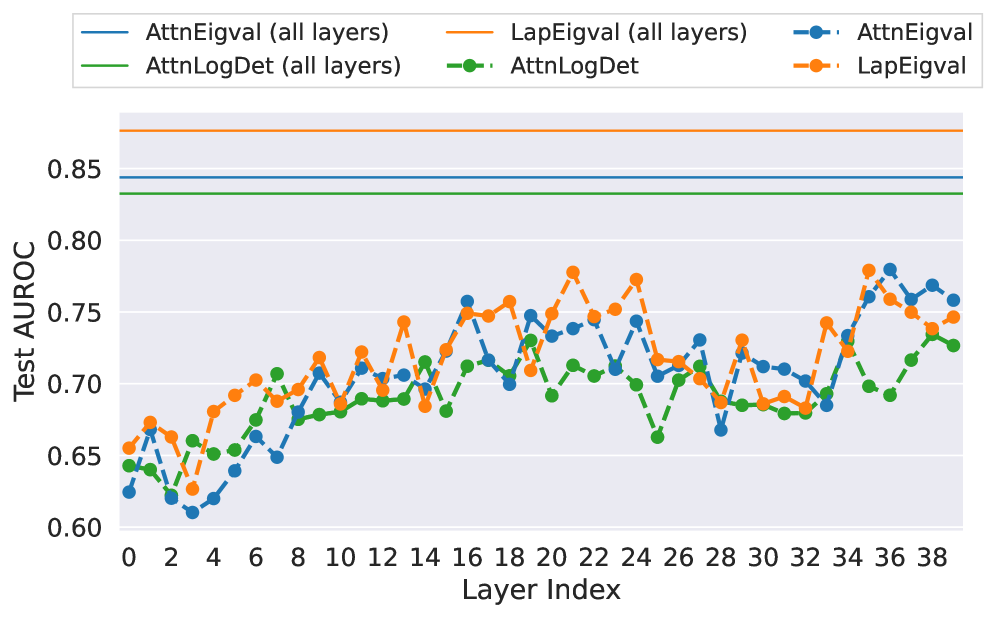
The chart compares test AUC-ROC performance across 39 layers (0-38) for four attention mechanism variants: AttnEigval, LapEigval, and AttnLogDet. Two versions of each variant are shown: "all layers" (solid lines) and "single layer" (dashed lines). Horizontal reference lines at 0.85 and 0.84 provide performance benchmarks.
### Components/Axes
- **X-axis**: Layer Index (0-38, increments of 2)
- **Y-axis**: Test AUC-ROC (0.60-0.85, increments of 0.05)
- **Legend**:
- Top-left position
- Solid blue: AttnEigval (all layers)
- Solid orange: LapEigval (all layers)
- Solid green: AttnLogDet (all layers)
- Dashed blue: AttnEigval (single layer)
- Dashed orange: LapEigval (single layer)
- **Reference Lines**:
- Solid orange at 0.85
- Solid blue at 0.84
### Detailed Analysis
1. **AttnEigval (all layers)**:
- Solid blue line
- Starts at ~0.63 (layer 0)
- Peaks at ~0.78 (layer 16)
- Ends at ~0.76 (layer 38)
- Smooth upward trend with minor fluctuations
2. **LapEigval (all layers)**:
- Solid orange line
- Starts at ~0.65 (layer 0)
- Peaks at ~0.77 (layer 22)
- Ends at ~0.75 (layer 38)
- More pronounced oscillations than AttnEigval
3. **AttnLogDet (all layers)**:
- Solid green line
- Starts at ~0.64 (layer 0)
- Peaks at ~0.72 (layer 18)
- Ends at ~0.73 (layer 38)
- Gradual increase with mid-chart dip
4. **AttnEigval (single layer)**:
- Dashed blue line
- Starts at ~0.62 (layer 0)
- Peaks at ~0.77 (layer 16)
- Ends at ~0.76 (layer 38)
- Similar trend to solid line but with sharper fluctuations
5. **LapEigval (single layer)**:
- Dashed orange line
- Starts at ~0.63 (layer 0)
- Peaks at ~0.76 (layer 22)
- Ends at ~0.75 (layer 38)
- More volatile than solid line counterpart
### Key Observations
- All series remain below the 0.85 benchmark line
- Solid lines (all layers) show smoother trends than dashed lines
- LapEigval variants exhibit higher volatility across layers
- AttnEigval (all layers) achieves highest final AUC-ROC (~0.76)
- Layer 16 shows peak performance for multiple variants
- No series reaches the 0.84 benchmark line
### Interpretation
The chart demonstrates that attention mechanisms with "all layers" configuration generally outperform single-layer implementations, though with reduced volatility. The horizontal reference lines suggest these models fall short of higher performance thresholds, indicating potential for optimization. The consistent peaks around layer 16 across variants suggest this layer index may be critical for attention mechanism effectiveness. The divergence between solid and dashed lines highlights the importance of layer aggregation in maintaining stable performance metrics.