## Chart/Diagram Type: Comparative Analysis of Agent Behavior in Easy vs. Difficult Setups
### Overview
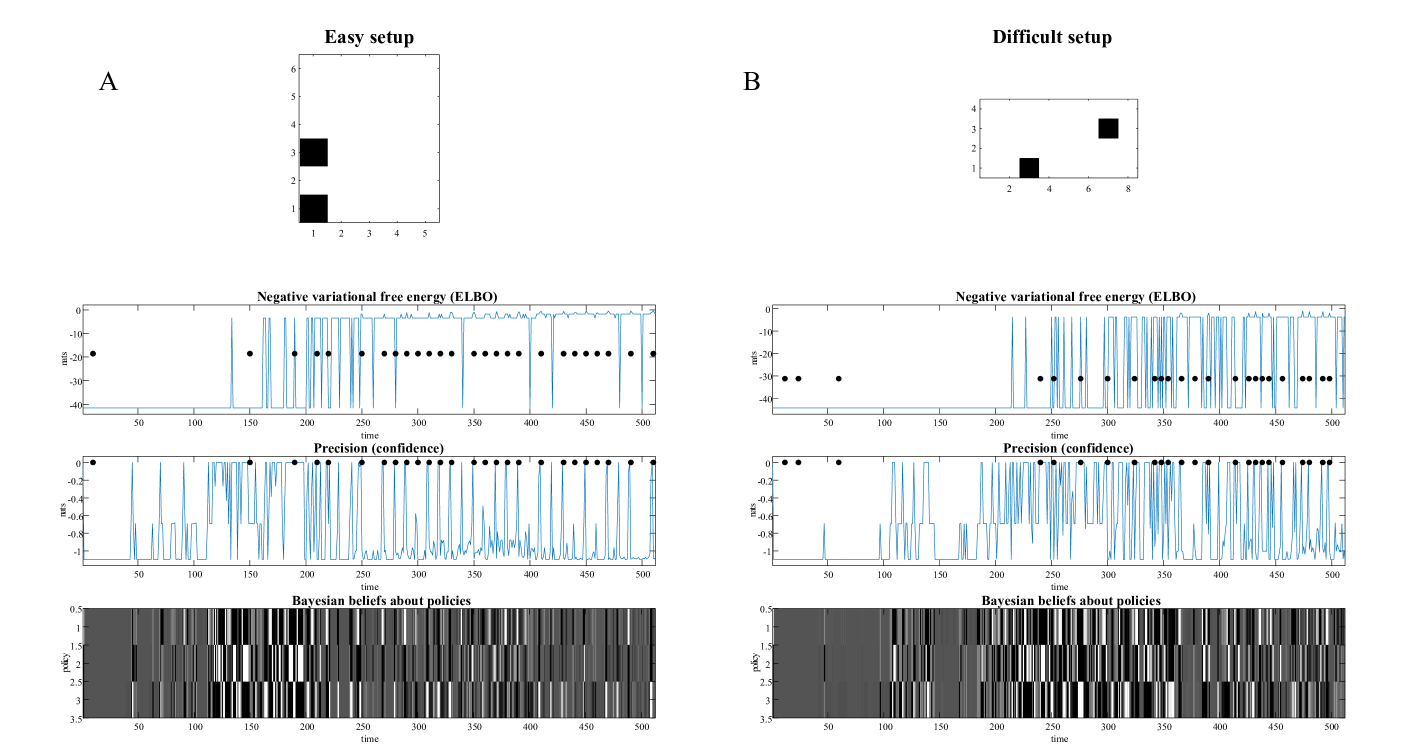
The image presents a comparative analysis of an agent's behavior in two different setups: an "Easy setup" (left column, labeled A) and a "Difficult setup" (right column, labeled B). For each setup, the image shows a schematic of the environment, a plot of the negative variational free energy (ELBO) over time, a plot of precision (confidence) over time, and a heatmap representing Bayesian beliefs about policies over time. The x-axis for all plots is "time".
### Components/Axes
**Top Row: Environment Schematics**
* **Easy setup (A):** A 5x6 grid with two black squares. One square is at approximately (1,1) and the other at (1,3).
* **Difficult setup (B):** An 8x4 grid with two black squares. One square is at approximately (2,1) and the other at (7,3).
**Middle Row: Negative Variational Free Energy (ELBO)**
* **Y-axis:** Labeled "nits", ranging from approximately -40 to 0.
* **X-axis:** Labeled "time", ranging from 0 to 500.
* **Easy setup (A):** The ELBO plot shows a fluctuating line, mostly near 0, with occasional drops to around -20 to -40. Black dots are overlaid on the line at various time points.
* **Difficult setup (B):** The ELBO plot shows a fluctuating line, mostly near 0, with frequent drops to around -20 to -40. Black dots are overlaid on the line at various time points.
**Third Row: Precision (confidence)**
* **Y-axis:** Labeled "nits", ranging from approximately -1 to 0.
* **X-axis:** Labeled "time", ranging from 0 to 500.
* **Easy setup (A):** The precision plot shows a fluctuating line, mostly near 0, with occasional drops to around -0.8 to -1. Black dots are overlaid on the line at various time points.
* **Difficult setup (B):** The precision plot shows a fluctuating line, mostly near 0, with frequent drops to around -0.8 to -1. Black dots are overlaid on the line at various time points.
**Bottom Row: Bayesian Beliefs About Policies**
* **Y-axis:** Labeled "policy", ranging from 0.5 to 3.5.
* **X-axis:** Labeled "time", ranging from 0 to 500.
* **Easy setup (A):** The heatmap shows vertical stripes of varying shades of gray, representing the agent's belief in different policies over time.
* **Difficult setup (B):** The heatmap shows vertical stripes of varying shades of gray, representing the agent's belief in different policies over time. The stripes appear more fragmented and less consistent than in the "Easy setup".
### Detailed Analysis
**Negative Variational Free Energy (ELBO) - Easy Setup (A):**
* The ELBO line starts at approximately -20 nits at time 0.
* The line fluctuates, mostly staying near 0 nits, with drops to -20 to -40 nits at times around 150, 200, 250, 300, 350, 400, 450, and 500.
**Negative Variational Free Energy (ELBO) - Difficult Setup (B):**
* The ELBO line starts at approximately -30 nits at time 0.
* The line fluctuates more frequently than in the "Easy setup", with drops to -20 to -40 nits at times around 50, 250, 300, 350, 400, 450, and 500.
**Precision (confidence) - Easy Setup (A):**
* The precision line starts at approximately -0.2 nits at time 0.
* The line fluctuates, mostly staying near 0 nits, with drops to -0.8 to -1 nits at times around 50, 150, 200, 250, 300, 350, 400, 450, and 500.
**Precision (confidence) - Difficult Setup (B):**
* The precision line starts at approximately -0.1 nits at time 0.
* The line fluctuates more frequently than in the "Easy setup", with drops to -0.8 to -1 nits at times around 50, 100, 150, 200, 250, 300, 350, 400, 450, and 500.
**Bayesian Beliefs About Policies - Easy Setup (A):**
* The heatmap shows relatively consistent vertical stripes, indicating a more stable belief in certain policies over time.
**Bayesian Beliefs About Policies - Difficult Setup (B):**
* The heatmap shows more fragmented and less consistent vertical stripes, indicating a less stable belief in certain policies over time.
### Key Observations
* The "Difficult setup" exhibits more frequent fluctuations in both ELBO and precision compared to the "Easy setup".
* The Bayesian beliefs about policies are more stable in the "Easy setup" than in the "Difficult setup".
* The black dots overlaid on the ELBO and precision plots appear to correspond to the times when the values drop significantly.
### Interpretation
The data suggests that the agent experiences more uncertainty and difficulty in the "Difficult setup" compared to the "Easy setup". This is reflected in the more frequent fluctuations in ELBO and precision, as well as the less stable Bayesian beliefs about policies. The black dots likely represent key decision points or events where the agent's confidence decreases, leading to a drop in ELBO and precision. The "Easy setup" allows the agent to maintain a more consistent belief in its policies, leading to more stable performance. The "Difficult setup" forces the agent to constantly re-evaluate its policies, resulting in more volatile behavior.