\n
## Charts: Variational Free Energy, Precision, and Bayesian Beliefs
### Overview
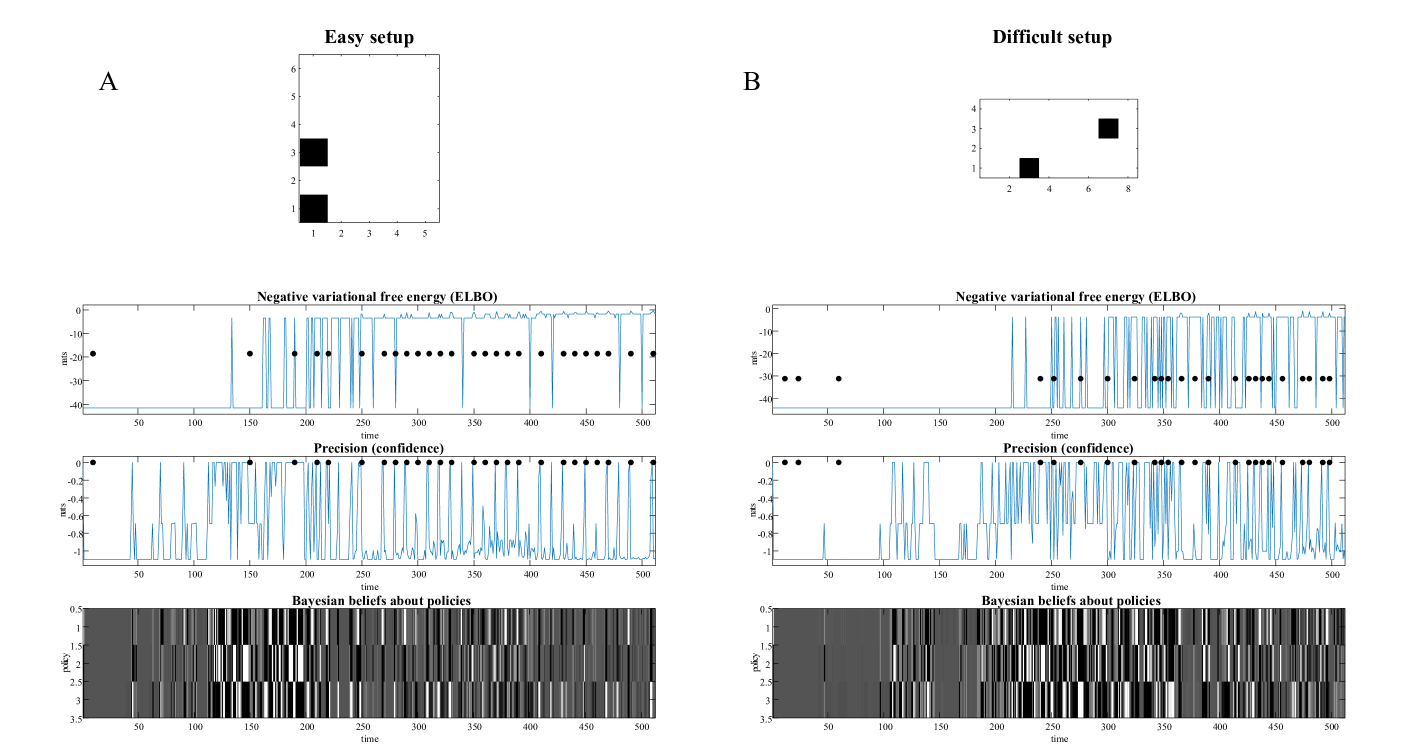
The image presents a comparative analysis of model performance under two different setup conditions: "Easy setup" (A) and "Difficult setup" (B). Each setup is evaluated across three metrics: Negative variational free energy (ELBO), Precision (confidence), and Bayesian beliefs about policies. The data is visualized as time series plots with error bars, and a heatmap representing Bayesian beliefs.
### Components/Axes
Each setup (A and B) contains three sub-charts arranged vertically:
* **Negative variational free energy (ELBO):** Y-axis labeled "ELBO", ranging from approximately -45 to 5. X-axis labeled "time", ranging from 0 to 500. A blue line represents the ELBO value over time, with black dots marking specific points.
* **Precision (confidence):** Y-axis labeled "Precision (confidence)", ranging from approximately -0.5 to 0.5. X-axis labeled "time", ranging from 0 to 500. A blue line with error bars represents the precision over time.
* **Bayesian beliefs about policies:** Y-axis labeled "policy", ranging from approximately 0.5 to 3.5. X-axis labeled "time", ranging from 0 to 500. A heatmap visualizes the Bayesian beliefs, with darker shades representing higher belief values.
Additionally, each setup (A and B) includes a small inset plot at the top-right corner, showing a scatter plot with a fitted line. These plots likely represent the overall performance trend.
### Detailed Analysis or Content Details
**Setup A (Easy Setup)**
* **ELBO:** The ELBO line initially fluctuates significantly between time 0 and 200, ranging from approximately -35 to 0. After time 200, the line stabilizes around a value of approximately 0, with minor fluctuations.
* **Precision:** The precision line exhibits high-frequency oscillations throughout the entire time range. The values generally fluctuate between approximately -0.3 and 0.3.
* **Bayesian Beliefs:** The heatmap shows a pattern of alternating dark and light bands. The darker bands (higher beliefs) are more prominent between time 50 and 300. The policy values with the highest beliefs appear to be around 1.5 and 2.5.
* **Inset Plot:** The inset plot shows a scatter of points with a positive trend. The x-axis ranges from approximately 1 to 6, and the y-axis ranges from approximately 0 to 5.
**Setup B (Difficult Setup)**
* **ELBO:** Similar to Setup A, the ELBO line fluctuates significantly between time 0 and 200, ranging from approximately -40 to 2. After time 200, the line stabilizes around a value of approximately 0, with more pronounced fluctuations than in Setup A.
* **Precision:** The precision line also exhibits high-frequency oscillations, but the amplitude of the oscillations appears slightly larger than in Setup A. The values generally fluctuate between approximately -0.4 and 0.4.
* **Bayesian Beliefs:** The heatmap shows a more dispersed pattern of dark and light bands compared to Setup A. The darker bands (higher beliefs) are less consistent and appear more scattered throughout the time range. The policy values with the highest beliefs appear to be around 1.5 and 2.5.
* **Inset Plot:** The inset plot shows a scatter of points with a positive trend, but the points are more scattered than in Setup A. The x-axis ranges from approximately 1 to 6, and the y-axis ranges from approximately 0 to 2.
### Key Observations
* Both setups exhibit similar initial fluctuations in ELBO, followed by stabilization.
* The precision in both setups is characterized by high-frequency oscillations.
* The Bayesian belief heatmaps reveal distinct patterns, with Setup A showing more consistent bands and Setup B showing a more dispersed pattern.
* The inset plots suggest a positive correlation between the x and y variables, but the scatter in Setup B is greater.
* The fluctuations in ELBO and Precision are more pronounced in the "Difficult setup" (B) compared to the "Easy setup" (A).
### Interpretation
The data suggests that the "Easy setup" (A) leads to more stable and consistent model performance compared to the "Difficult setup" (B). The ELBO values stabilize more quickly in Setup A, and the precision exhibits less pronounced oscillations. The Bayesian belief heatmap in Setup A indicates a clearer preference for certain policies, while the heatmap in Setup B shows a more uncertain distribution of beliefs.
The inset plots likely represent the overall performance trend, and the greater scatter in Setup B suggests that the performance is more variable under the difficult setup conditions.
The differences between the two setups highlight the impact of the setup conditions on model learning and decision-making. The "Difficult setup" may involve more complex or ambiguous environments, leading to increased uncertainty and variability in the model's behavior. The data suggests that the model is able to learn and adapt to both setups, but the performance is more reliable and consistent in the "Easy setup".