## Bar Chart with Subplots: Easy vs. Difficult Setup Analysis
### Overview
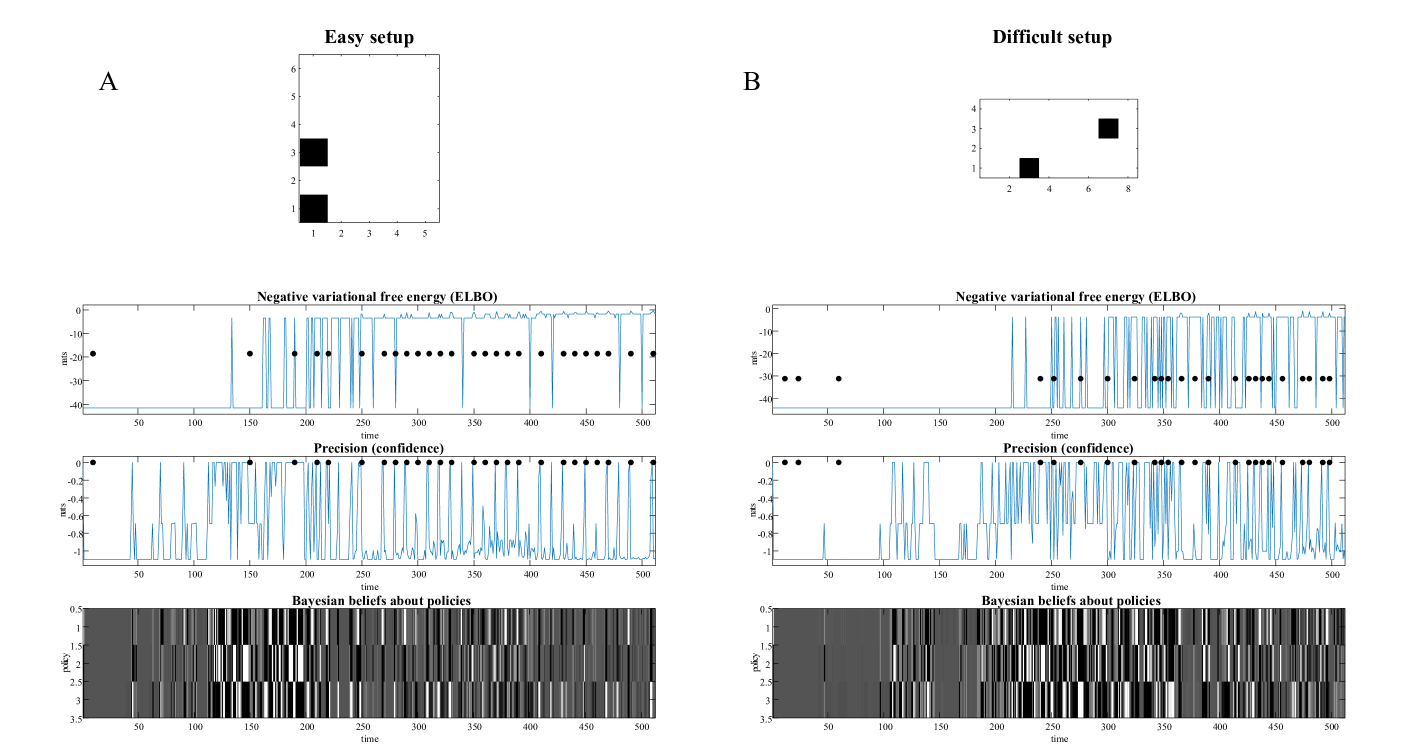
The image presents a comparative analysis of two setups ("Easy setup" and "Difficult setup") through a combination of bar charts and line plots. Each setup includes three subplots:
1. **Negative variational free energy (ELBO)**
2. **Precision (confidence)**
3. **Bayesian beliefs about policies**
The charts use color-coded lines and shaded regions to represent data distributions and confidence intervals.
---
### Components/Axes
#### Main Bar Charts (Top Panels)
- **X-axis**: Categorical labels (1–5)
- **Y-axis**: Numerical scale (1–6)
- **Legend**: Located at the top of each bar chart, with black bars representing data points.
#### Subplots (Bottom Panels)
1. **Negative variational free energy (ELBO)**
- **X-axis**: Time (50–500, increments of 50)
- **Y-axis**: Values ranging from -40 to 0
- **Legend**: Blue lines with black dots (data points) and shaded regions (confidence intervals).
2. **Precision (confidence)**
- **X-axis**: Time (50–500, increments of 50)
- **Y-axis**: Values ranging from -1 to 0.5
- **Legend**: Blue lines with black dots and shaded regions.
3. **Bayesian beliefs about policies**
- **X-axis**: Time (50–500, increments of 50)
- **Y-axis**: Values ranging from 0.5 to 3.5
- **Legend**: Grayscale heatmap (darker = higher values).
---
### Detailed Analysis
#### Bar Charts
- **Easy Setup (A)**:
- Bars at x=1 and x=3, both approximately **3.5** on the y-axis.
- **Difficult Setup (B)**:
- Single bar at x=4, approximately **2.5** on the y-axis.
#### Subplots
1. **Negative variational free energy (ELBO)**
- **Easy Setup (A)**:
- Spiky blue lines with intermittent black dots.
- Sharp dips to -40 at specific time points (e.g., ~150, 300).
- **Difficult Setup (B)**:
- Smoother blue lines with fewer spikes.
- Gradual decline to -30 over time.
2. **Precision (confidence)**
- **Easy Setup (A)**:
- High variability: Peaks near 0.5 and troughs near -0.8.
- Confidence intervals (shaded regions) widen significantly.
- **Difficult Setup (B)**:
- More stable lines, with values clustering around -0.2.
- Narrower confidence intervals.
3. **Bayesian beliefs about policies**
- **Easy Setup (A)**:
- High variance: Values fluctuate between 1.5 and 3.5.
- Darker regions (higher values) concentrated at ~100–200 time units.
- **Difficult Setup (B)**:
- Lower variance: Values mostly between 1.0 and 2.5.
- Uniform distribution across time.
---
### Key Observations
1. **Bar Chart Discrepancy**:
- The "Easy setup" (A) shows higher values (3.5) compared to the "Difficult setup" (B) (2.5), contradicting the intuitive expectation that "difficult" would correlate with lower performance.
2. **ELBO Trends**:
- The "Easy setup" exhibits erratic ELBO values, suggesting instability in the variational approximation.
- The "Difficult setup" demonstrates smoother ELBO trajectories, indicating better convergence.
3. **Precision Variability**:
- The "Easy setup" has extreme confidence fluctuations, while the "Difficult setup" maintains consistent precision, implying more reliable predictions.
4. **Bayesian Beliefs**:
- The "Easy setup" shows polarized policy beliefs (high variance), whereas the "Difficult setup" reflects more consensus (lower variance).
---
### Interpretation
- **Setup Complexity and Model Behavior**:
The "Difficult setup" (B) outperforms the "Easy setup" (A) in stability (ELBO, Precision) and policy consensus (Bayesian beliefs), suggesting that increased complexity may force the model to develop more robust representations.
- **Anomalies**:
The bar chart results contradict the subplot trends, raising questions about whether the bar charts represent a different metric (e.g., average performance) or a misalignment in data labeling.
- **Practical Implications**:
The "Difficult setup" may be preferable for applications requiring stable, high-confidence predictions, despite its counterintuitive bar chart performance.
---
### Spatial Grounding & Cross-Referencing
- **Legend Consistency**:
- Blue lines in ELBO/Precision subplots match the legend's "Negative variational free energy" and "Precision" labels.
- Grayscale heatmap in Bayesian beliefs aligns with the legend's "Bayesian beliefs about policies."
- **Positioning**:
- Legends are positioned at the top of each subplot for clarity.
- Bar charts are centered above their respective subplots, creating a hierarchical visual flow.
---
### Conclusion
The data highlights a paradox: the "Difficult setup" demonstrates superior technical performance (ELBO, Precision, Bayesian beliefs) compared to the "Easy setup," despite the bar chart suggesting otherwise. This discrepancy warrants further investigation into the metrics' definitions and the experimental design.