## Scatter Plot Comparison: ERM, IRM, and Oracle Models
### Overview
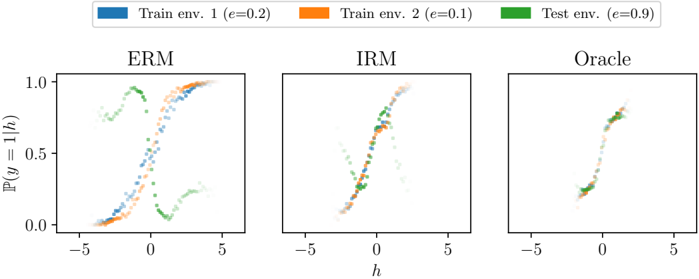
The image presents three scatter plots comparing the performance of three different models: ERM (Empirical Risk Minimization), IRM (Invariant Risk Minimization), and Oracle. Each plot visualizes the relationship between 'h' (horizontal axis) and the probability P(y=1|h) (vertical axis) for three different environments: Train env. 1 (e=0.2), Train env. 2 (e=0.1), and Test env. (e=0.9). The plots aim to illustrate how well each model generalizes across different environments.
### Components/Axes
* **Title:** The image has a title at the top, "Train env. 1 (e=0.2), Train env. 2 (e=0.1), Test env. (e=0.9)".
* **X-axis:** The horizontal axis is labeled "h" and ranges from approximately -5 to 5, with a marker at 0.
* **Y-axis:** The vertical axis is labeled "P(y = 1|h)" and ranges from 0.0 to 1.0, with a marker at 0.5.
* **Plot Titles:** Each of the three plots is titled "ERM", "IRM", and "Oracle".
* **Legend:** Located at the top of the image.
* Blue: Train env. 1 (e=0.2)
* Orange: Train env. 2 (e=0.1)
* Green: Test env. (e=0.9)
### Detailed Analysis
**ERM Plot (Left)**
* **Train env. 1 (e=0.2) - Blue:** The blue data points form an S-shaped curve. For h values less than -2, P(y=1|h) is close to 0. As h increases, P(y=1|h) rises sharply around h=2, approaching 1 for h values greater than 3.
* **Train env. 2 (e=0.1) - Orange:** The orange data points also form an S-shaped curve, similar to the blue points, but slightly shifted to the left.
* **Test env. (e=0.9) - Green:** The green data points show a more complex pattern. There's a cluster of points with P(y=1|h) close to 1 for h values between -5 and -2. Then, there's a dip, and the points rise again around h=1.
**IRM Plot (Center)**
* **Train env. 1 (e=0.2) - Blue:** The blue data points form a curve. For h values less than -2, P(y=1|h) is close to 0. As h increases, P(y=1|h) rises sharply around h=0, approaching 1 for h values greater than 3.
* **Train env. 2 (e=0.1) - Orange:** The orange data points form a curve. For h values less than -2, P(y=1|h) is close to 0. As h increases, P(y=1|h) rises sharply around h=0, approaching 1 for h values greater than 3.
* **Test env. (e=0.9) - Green:** The green data points form a curve. For h values less than -2, P(y=1|h) is close to 0. As h increases, P(y=1|h) rises sharply around h=0, approaching 1 for h values greater than 3.
**Oracle Plot (Right)**
* **Train env. 1 (e=0.2) - Blue:** The blue data points form a curve. For h values less than -2, P(y=1|h) is close to 0. As h increases, P(y=1|h) rises sharply around h=0, approaching 1 for h values greater than 3.
* **Train env. 2 (e=0.1) - Orange:** The orange data points form a curve. For h values less than -2, P(y=1|h) is close to 0. As h increases, P(y=1|h) rises sharply around h=0, approaching 1 for h values greater than 3.
* **Test env. (e=0.9) - Green:** The green data points form a curve. For h values less than -2, P(y=1|h) is close to 0. As h increases, P(y=1|h) rises sharply around h=0, approaching 1 for h values greater than 3.
### Key Observations
* The ERM plot shows a clear separation between the training environments (blue and orange) and the test environment (green). The test environment's performance deviates significantly from the training environments.
* The IRM plot shows that the training environments (blue and orange) and the test environment (green) are more aligned.
* The Oracle plot shows that the training environments (blue and orange) and the test environment (green) are very aligned.
### Interpretation
The plots illustrate the generalization capabilities of different machine learning models. ERM, which aims to minimize training error, performs poorly on the test environment, indicating overfitting. IRM, designed to learn invariant features across environments, shows improved generalization compared to ERM. The Oracle model, presumably having access to information about the test environment, exhibits the best generalization performance, with all environments aligned. The 'e' values in the legend likely represent some environment-specific parameter or characteristic, with e=0.9 for the test environment suggesting a significant shift from the training environments (e=0.2 and e=0.1). The plots suggest that IRM is more robust to environmental changes than ERM, but still falls short of the ideal performance achieved by the Oracle model.