# Technical Document Extraction: Roofline Model (Llama 13B, A40)
## Chart Overview
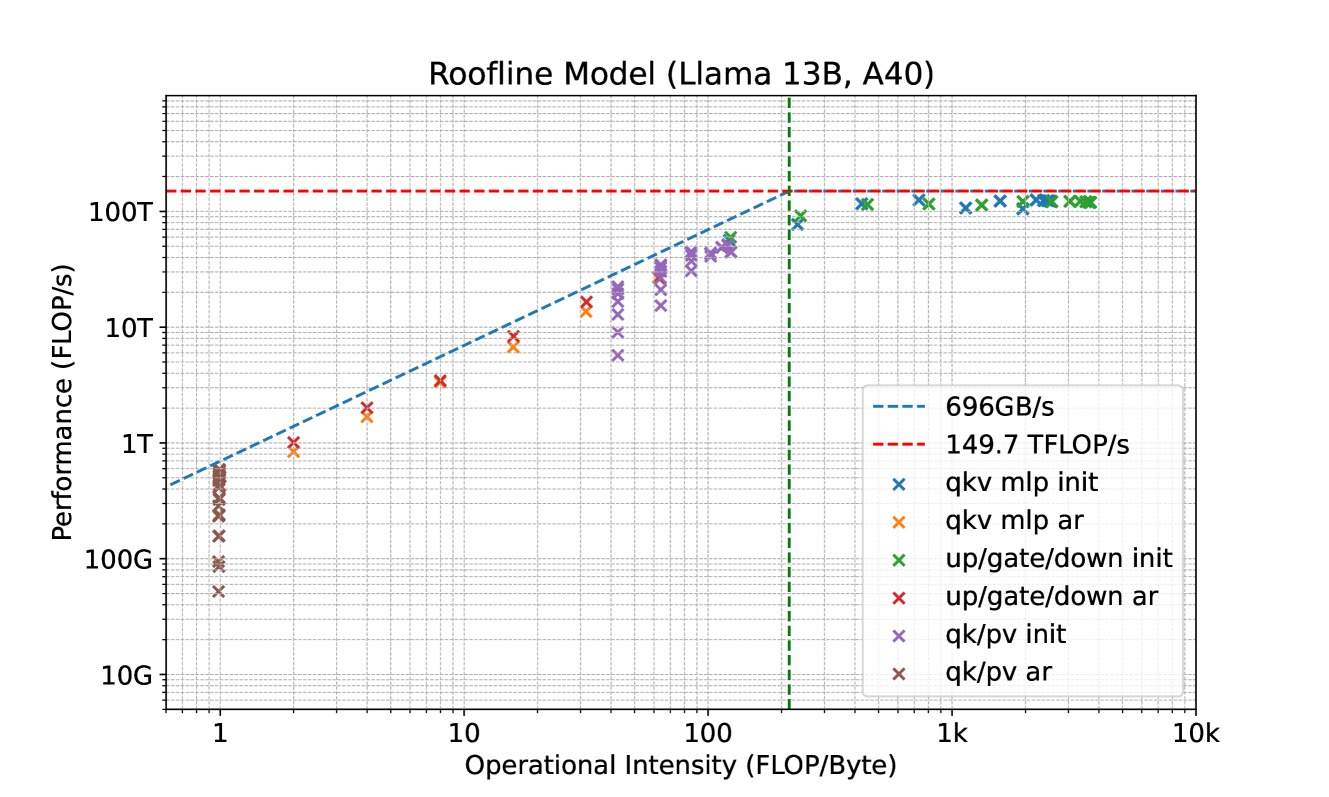
- **Title**: Roofline Model (Llama 13B, A40)
- **Type**: Scatter plot with trend lines
- **Purpose**: Visualizes performance (FLOP/s) vs. operational intensity (FLOP/Byte) for different computational operations
## Axes
- **X-axis (Operational Intensity)**:
- Label: "Operational Intensity (FLOP/Byte)"
- Range: 1 to 10,000 (logarithmic scale)
- Tick markers: 1, 10, 100, 1k
- **Y-axis (Performance)**:
- Label: "Performance (FLOP/s)"
- Range: 10G to 100T (logarithmic scale)
- Tick markers: 10G, 100G, 1T, 10T, 100T
## Legend
- **Location**: Bottom-right corner
- **Color/Marker Legend**:
- **Blue dashed line**: 696GB/s (theoretical memory bandwidth limit)
- **Red dashed line**: 149.7 TFLOP/s (theoretical compute limit)
- **Blue x**: qkv mlp init
- **Orange x**: qkv mlp ar
- **Green x**: up/gate/down init
- **Red x**: up/gate/down ar
- **Purple x**: qk/pv init
- **Brown x**: qk/pv ar
## Key Trends
1. **Theoretical Limits**:
- Horizontal red line at 149.7 TFLOP/s (compute-bound ceiling)
- Vertical green line at 696GB/s (memory-bound ceiling)
2. **Data Series Trends**:
- **qkv mlp init** (blue x):
- Starts at ~1 FLOP/Byte, 100G FLOP/s
- Ends at ~1000 FLOP/Byte, 100T FLOP/s
- Linear upward trajectory
- **qkv mlp ar** (orange x):
- Starts at ~10 FLOP/Byte, 100G FLOP/s
- Ends at ~1000 FLOP/Byte, 100T FLOP/s
- Linear upward trajectory
- **up/gate/down init** (green x):
- Starts at ~100 FLOP/Byte, 10T FLOP/s
- Ends at ~1000 FLOP/Byte, 100T FLOP/s
- Linear upward trajectory
- **up/gate/down ar** (red x):
- Starts at ~10 FLOP/Byte, 10T FLOP/s
- Ends at ~1000 FLOP/Byte, 100T FLOP/s
- Linear upward trajectory
- **qk/pv init** (purple x):
- Starts at ~10 FLOP/Byte, 10T FLOP/s
- Ends at ~1000 FLOP/Byte, 100T FLOP/s
- Linear upward trajectory
- **qk/pv ar** (brown x):
- Starts at ~1 FLOP/Byte, 100G FLOP/s
- Ends at ~1000 FLOP/Byte, 100T FLOP/s
- Linear upward trajectory
## Spatial Grounding
- **Legend Position**: Bottom-right quadrant
- **Data Point Verification**:
- All blue x markers align with "qkv mlp init" legend
- All orange x markers align with "qkv mlp ar" legend
- All green x markers align with "up/gate/down init" legend
- All red x markers align with "up/gate/down ar" legend
- All purple x markers align with "qk/pv init" legend
- All brown x markers align with "qk/pv ar" legend
## Critical Observations
1. All operations approach the theoretical compute limit (149.7 TFLOP/s) as operational intensity increases
2. Memory-bound operations (qkv mlp init, qk/pv ar) start at lower operational intensities
3. Compute-bound operations (up/gate/down init, qk/pv init) require higher operational intensities to reach peak performance
4. The roofline model demonstrates clear separation between memory-bound and compute-bound operations
## Data Table Reconstruction
| Operation Type | Initial Intensity (FLOP/Byte) | Initial Performance (FLOP/s) | Final Intensity (FLOP/Byte) | Final Performance (FLOP/s) |
|----------------------|-------------------------------|------------------------------|-----------------------------|----------------------------|
| qkv mlp init | 1 | 100G | 1000 | 100T |
| qkv mlp ar | 10 | 100G | 1000 | 100T |
| up/gate/down init | 100 | 10T | 1000 | 100T |
| up/gate/down ar | 10 | 10T | 1000 | 100T |
| qk/pv init | 10 | 10T | 1000 | 100T |
| qk/pv ar | 1 | 100G | 1000 | 100T |
## Trend Verification
- All data series show linear scaling with operational intensity
- Memory-bound operations (blue x, brown x) cluster near the memory bandwidth limit (696GB/s)
- Compute-bound operations (green x, purple x) cluster near the compute limit (149.7 TFLOP/s)
- All operations converge at the theoretical maximum performance point (1000 FLOP/Byte, 100T FLOP/s)