# Technical Document Extraction: Roofline Model (Llama 13B, A40)
## 1. Document Header
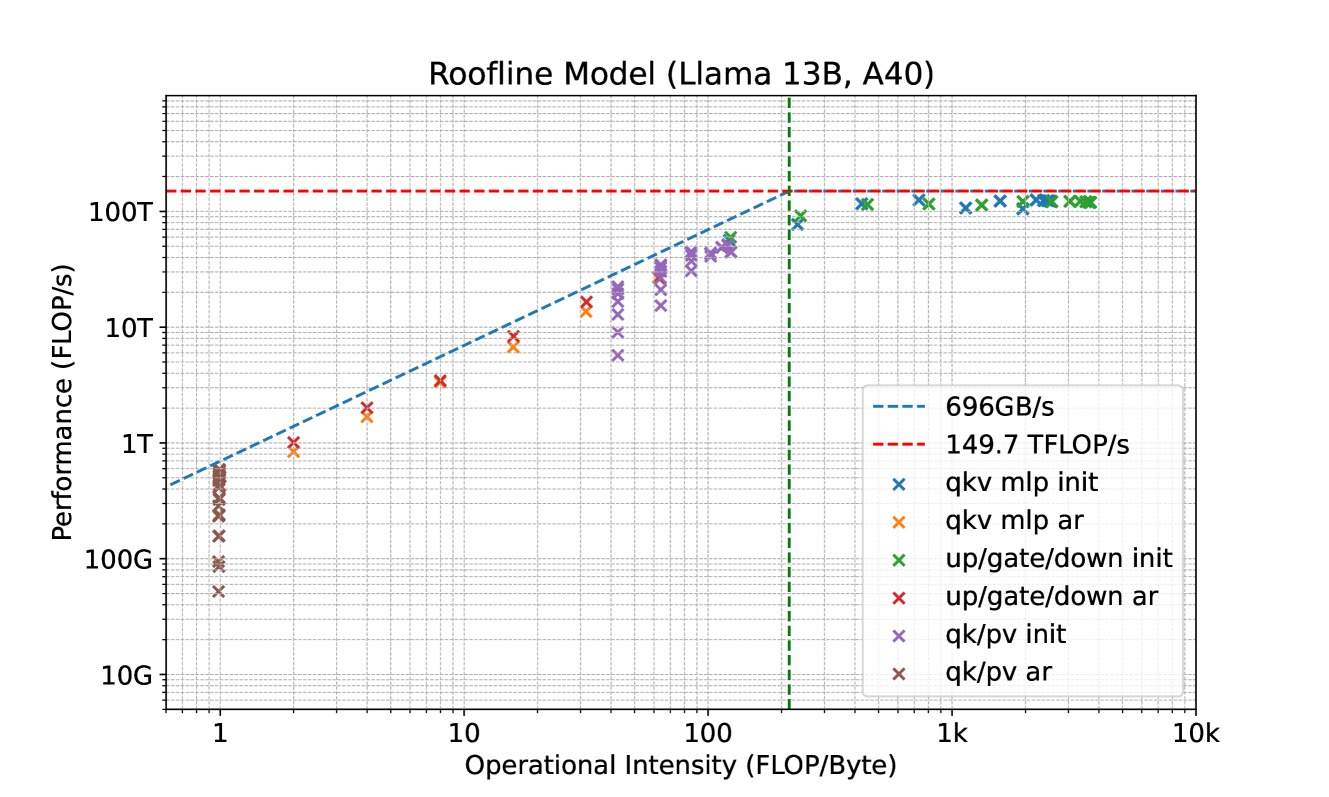
* **Title:** Roofline Model (Llama 13B, A40)
* **Subject:** Performance analysis of the Llama 13B model running on an NVIDIA A40 GPU.
## 2. Chart Specifications
The image is a **Roofline Chart**, a standard visualization used to identify performance bottlenecks in computing workloads.
### Axis Definitions
* **Y-Axis (Vertical):** Performance (FLOP/s)
* **Scale:** Logarithmic (Base 10).
* **Markers:** 10G, 100G, 1T, 10T, 100T.
* **X-Axis (Horizontal):** Operational Intensity (FLOP/Byte)
* **Scale:** Logarithmic (Base 10).
* **Markers:** 1, 10, 100, 1k (1,000), 10k (10,000).
### Legend and Thresholds
The legend is located in the bottom-right quadrant of the chart area.
| Legend Item | Color/Style | Description | Value/Threshold |
| :--- | :--- | :--- | :--- |
| **696GB/s** | Blue Dashed Line | Memory Bandwidth Limit | Slopes upward at 45° (log-log) |
| **149.7 TFLOP/s** | Red Dashed Line | Peak Compute Performance | Horizontal line at ~1.5e14 |
| **Ridge Point** | Green Vertical Dashed | Intersection of Bandwidth and Compute | ~215 FLOP/Byte |
| **qkv mlp init** | Blue 'x' | Initialization phase for QKV/MLP layers | Compute-bound region |
| **qkv mlp ar** | Orange 'x' | Autoregressive phase for QKV/MLP layers | Memory-bound region |
| **up/gate/down init** | Green 'x' | Initialization phase for Up/Gate/Down layers | Compute-bound region |
| **up/gate/down ar** | Red 'x' | Autoregressive phase for Up/Gate/Down layers | Memory-bound region |
| **qk/pv init** | Purple 'x' | Initialization phase for QK/PV layers | Transition region |
| **qk/pv ar** | Brown 'x' | Autoregressive phase for QK/PV layers | Memory-bound region |
---
## 3. Component Analysis and Data Trends
### Region 1: Memory-Bound (Left of the Ridge Point)
* **Visual Trend:** Data points follow the upward slope of the blue dashed line (696GB/s).
* **Observations:**
* **Autoregressive (ar) phases** (Orange, Red, Brown 'x' marks) are clustered here.
* **qk/pv ar (Brown):** Lowest operational intensity (~1 FLOP/Byte), resulting in the lowest performance (between 50G and 1T FLOP/s).
* **up/gate/down ar (Red) & qkv mlp ar (Orange):** Higher intensity than qk/pv ar, ranging from ~2 to ~40 FLOP/Byte. Performance scales linearly with intensity along the bandwidth limit.
### Region 2: Compute-Bound (Right of the Ridge Point)
* **Visual Trend:** Data points flatten out and cluster along the horizontal red dashed line (149.7 TFLOP/s).
* **Observations:**
* **Initialization (init) phases** (Blue, Green 'x' marks) are clustered here.
* **up/gate/down init (Green):** High operational intensity (approx. 400 to 4,000 FLOP/Byte). These points are pinned against the 149.7 TFLOP/s ceiling, indicating maximum hardware utilization.
* **qkv mlp init (Blue):** Similar to the green series, these points sit at the peak performance ceiling with intensities between 1,000 and 3,000 FLOP/Byte.
### Region 3: Transition/Ridge Area
* **Visual Trend:** Points begin to deviate from the bandwidth slope and curve toward the compute ceiling.
* **Observations:**
* **qk/pv init (Purple):** These points bridge the gap, located between 40 and 150 FLOP/Byte. They show performance increasing from 10T to nearly 100T FLOP/s but remain below the absolute peak.
---
## 4. Summary of Findings
1. **Hardware Limits:** The A40 GPU used for Llama 13B has a peak throughput of **149.7 TFLOP/s** and a memory bandwidth of **696 GB/s**.
2. **Bottleneck Identification:**
* **Initialization phases** are **Compute-Bound**. They efficiently utilize the GPU's processing power because they have high operational intensity.
* **Autoregressive phases** (the generation step) are **Memory-Bound**. Their performance is limited by how fast data can be moved from memory, not by the GPU's calculation speed.
3. **Critical Threshold:** The "Ridge Point" occurs at approximately **215 FLOP/Byte**. Any operation with an intensity lower than this will be limited by memory bandwidth.