# Technical Document Extraction: Execution Time Analysis
## Chart Description
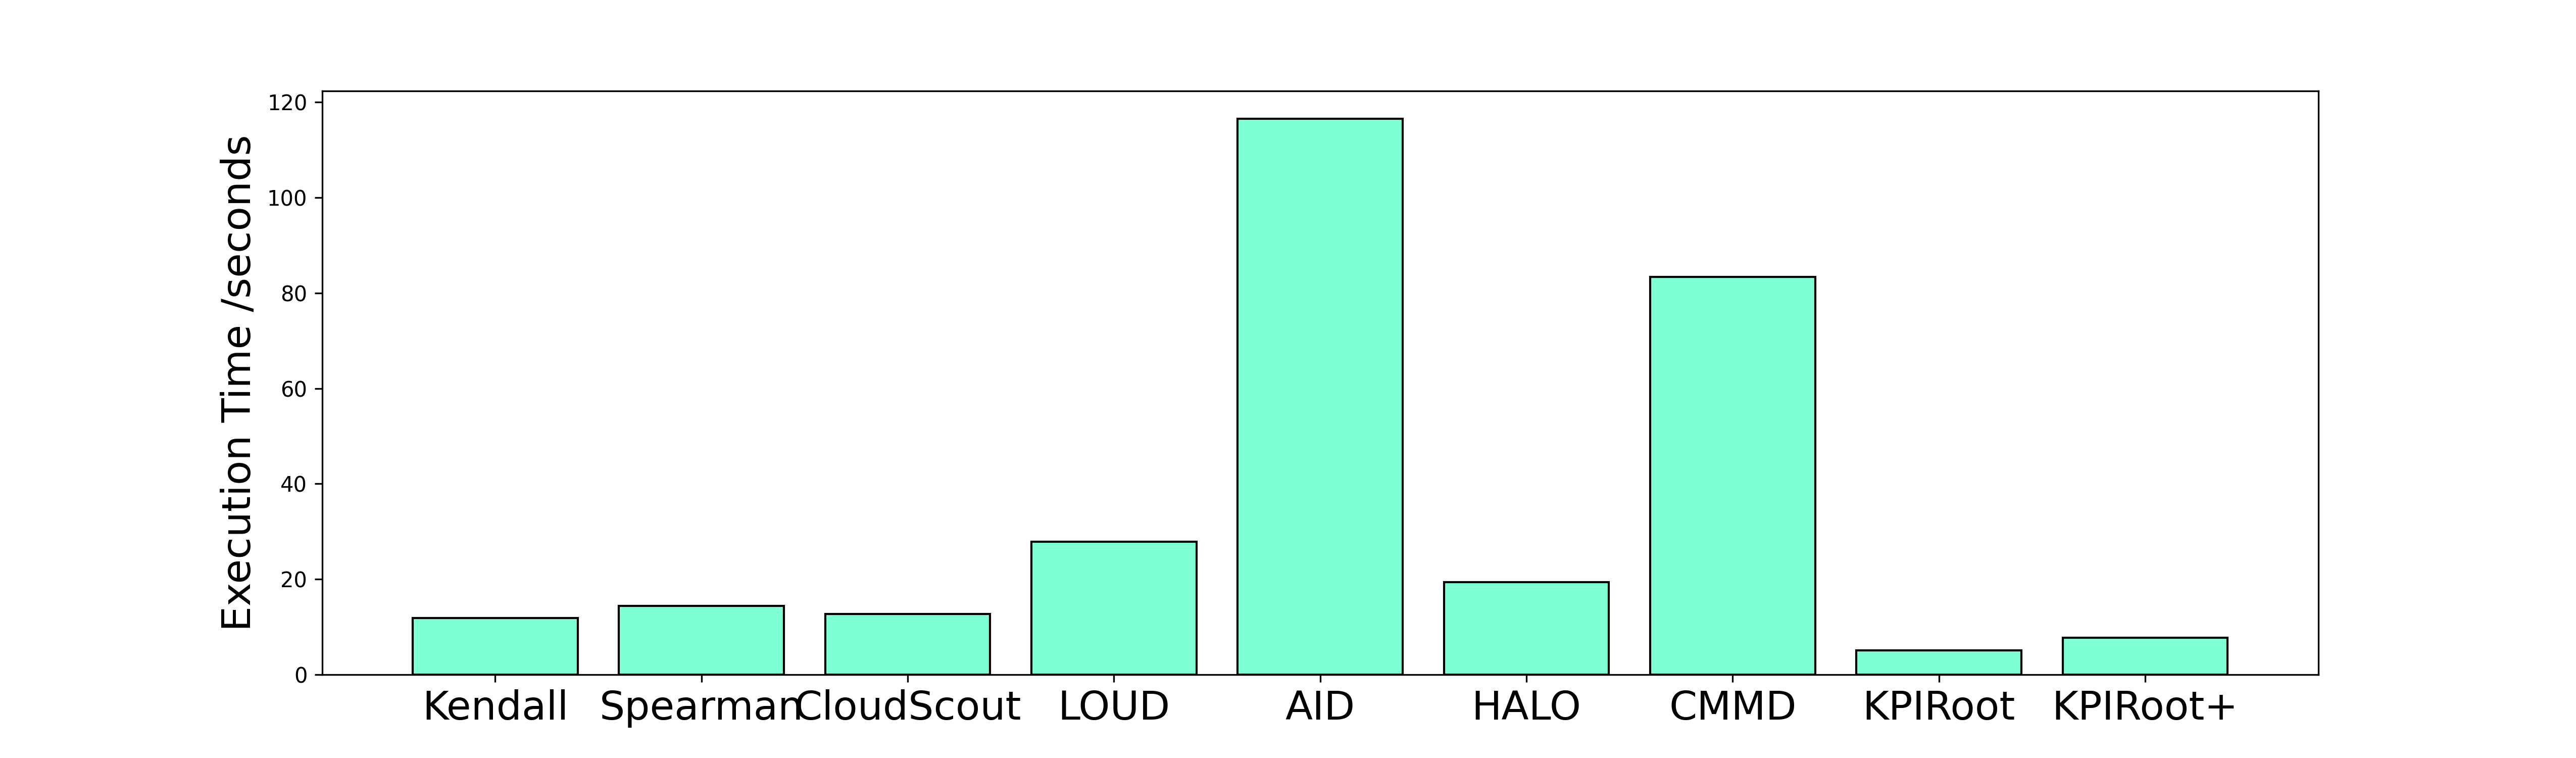
The image is a **bar chart** comparing **execution time (in seconds)** across multiple entities. The chart uses **light blue bars** to represent data points.
---
### Axis Labels
- **Y-Axis**: "Execution Time / seconds" (ranging from 0 to 120 in increments of 20).
- **X-Axis**: Categorical labels representing entities (see list below).
---
### Categories & Data Points
1. **Kendall**: ~10 seconds
2. **Spear**: ~15 seconds
3. **Cloud**: ~12 seconds
4. **LOUD**: ~30 seconds
5. **AID**: ~120 seconds (tallest bar)
6. **HALO**: ~20 seconds
7. **CMM**: ~80 seconds
8. **KPIRoot**: ~5 seconds
9. **KPIRoot+**: ~8 seconds
---
### Key Trends
- **AID** exhibits the **highest execution time** at approximately **120 seconds**, significantly exceeding all other entities.
- **CMM** follows with the second-highest execution time at **80 seconds**.
- **LOUD** (30 seconds) and **HALO** (20 seconds) show moderate execution times.
- **KPIRoot** and **KPIRoot+** have the **lowest execution times**, both below 10 seconds.
- The remaining entities (**Kendall**, **Spear**, **Cloud**) cluster between **10–15 seconds**.
---
### Visual Notes
- All bars are uniformly colored in **light blue**, with no additional legends or sub-categories.
- No textual annotations or embedded data tables are present in the chart.
---
### Summary
The chart highlights **AID** as the most time-intensive entity, while **KPIRoot** and **KPIRoot+** are the most efficient. Execution times vary widely, with a clear outlier at **AID**.