\n
## Diagram: Data Processing Pipeline
### Overview
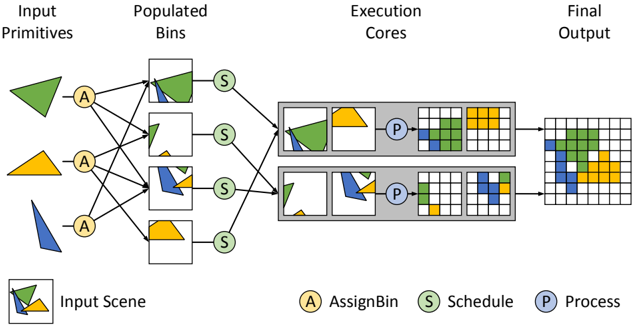
The image depicts a data processing pipeline with four stages: Input Primitives, Populated Bins, Execution Cores, and Final Output. The diagram illustrates how input primitives (triangles) are assigned to bins, scheduled for execution, processed within cores, and ultimately contribute to the final output represented as a grid. The diagram uses color-coding to represent different data types or categories throughout the pipeline.
### Components/Axes
The diagram is divided into four main sections, labeled from left to right:
* **Input Primitives:** Contains triangular shapes in yellow, green, and blue.
* **Populated Bins:** Contains square bins, some filled with shapes matching the input primitives.
* **Execution Cores:** Contains two rectangular blocks representing execution cores, each with a grid inside.
* **Final Output:** A grid composed of squares colored yellow, green, and blue.
The diagram also includes a legend at the bottom-left, defining the following symbols:
* **Input Scene:** Represented by a pattern of yellow, green, and blue squares.
* **A:** AssignBin (yellow circle)
* **S:** Schedule (green circle)
* **P:** Process (grey circle)
Lines with arrows connect the components, indicating the flow of data.
### Detailed Analysis or Content Details
**Input Primitives:**
* There are three input primitives: one yellow triangle, one green triangle, and one blue triangle.
* Each primitive is connected to multiple bins in the next stage via lines labeled "A" (AssignBin).
**Populated Bins:**
* There are four bins.
* The first bin contains a green triangle.
* The second bin contains a yellow triangle and a green shape.
* The third bin contains a yellow triangle and a blue shape.
* The fourth bin is empty.
* Each bin is connected to the Execution Cores via lines labeled "S" (Schedule).
**Execution Cores:**
* There are two execution cores.
* The top core contains a yellow triangle and a green shape.
* The bottom core contains a green shape and a blue shape.
* Each core is connected to the Final Output via lines labeled "P" (Process).
* Each core has a grid of 5x5 squares.
**Final Output:**
* The final output is a 5x5 grid.
* The grid contains yellow, green, and blue squares.
* The distribution of colors appears to be influenced by the processing within the execution cores.
* The top core contributes to the upper portion of the output grid, with a concentration of yellow and green squares.
* The bottom core contributes to the lower portion of the output grid, with a concentration of green and blue squares.
### Key Observations
* The pipeline demonstrates a process of assigning input primitives to bins, scheduling them for execution, and processing them to generate a final output.
* The color-coding suggests that different primitives are processed and represented differently in the final output.
* The two execution cores appear to operate in parallel, contributing to different parts of the final output.
* The diagram does not provide quantitative data, but illustrates a conceptual flow.
### Interpretation
The diagram illustrates a parallel processing pipeline. The input primitives are distributed across bins, and then processed concurrently by the two execution cores. The final output is a combination of the results from both cores. The use of color-coding suggests that the pipeline is designed to handle different types of data or features. The diagram highlights the key stages of the pipeline: assignment, scheduling, and processing. The diagram is a high-level representation of a data processing system, and does not provide details about the specific algorithms or operations performed at each stage. The diagram suggests a system designed for efficient processing of multiple inputs, leveraging parallel execution to accelerate the overall process.