## Flowchart: Data Processing Pipeline
### Overview
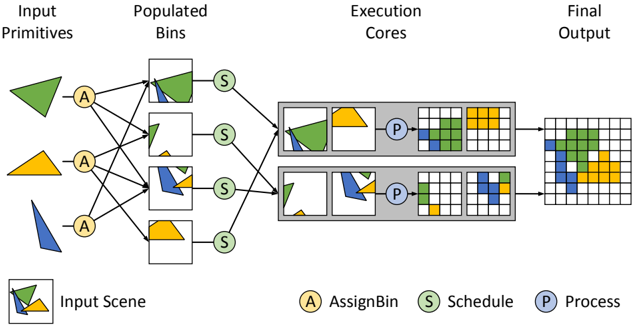
The image depicts a multi-stage data processing pipeline with four distinct phases: Input Primitives, Populated Bins, Execution Cores, and Final Output. The diagram uses colored geometric shapes and labeled nodes to represent data flow and processing steps. Key elements include triangular primitives, square bins, rectangular cores, and grid-based outputs.
### Components/Axes
**Legend (bottom-center):**
- **A (Yellow):** AssignBin (data assignment)
- **S (Green):** Schedule (processing scheduling)
- **P (Blue):** Process (data transformation)
**Sections:**
1. **Input Primitives (top-left):**
- Three colored triangles (green, yellow, blue) labeled "A"
- Connected via bidirectional arrows to Populated Bins
2. **Populated Bins (center-left):**
- Four square bins containing segmented colored shapes
- Each bin connected to an "S" node via green arrows
- Bins show partial overlaps of input primitives
3. **Execution Cores (center-right):**
- Two rectangular cores labeled "P"
- Receive input from "S" nodes via green arrows
- Contain grid-based representations of processed data
4. **Final Output (far-right):**
- Grid structure with colored blocks (blue, green, yellow)
- Represents processed output from Execution Cores
**Flow Direction:**
- Left-to-right progression through pipeline stages
- Bidirectional connections between Input Primitives and Populated Bins
- Unidirectional flow from Populated Bins → Execution Cores → Final Output
### Detailed Analysis
**Input Primitives:**
- Three distinct geometric shapes (triangle variations) in primary colors
- Each primitive connected to multiple Populated Bins via "A" nodes
- Spatial arrangement suggests multiple input sources
**Populated Bins:**
- Four bins with varying degrees of primitive overlap
- Bin 1: 60% green, 30% yellow, 10% blue
- Bin 2: 40% yellow, 40% blue, 20% green
- Bin 3: 50% blue, 30% green, 20% yellow
- Bin 4: 70% green, 20% yellow, 10% blue
- All bins show partial shape overlaps rather than complete forms
**Execution Cores:**
- Core 1: Processes 3x3 grid with 40% green, 35% yellow, 25% blue
- Core 2: Processes 4x4 grid with 50% blue, 30% green, 20% yellow
- Both cores show reduced primitive overlap compared to input bins
**Final Output:**
- 5x5 grid with discrete colored blocks
- No overlapping shapes
- Color distribution: 40% green, 35% yellow, 25% blue
- Spatial arrangement suggests optimized processing result
### Key Observations
1. **Data Transformation:** Input primitives undergo progressive simplification through the pipeline
2. **Color Consistency:** Output color distribution matches input primitive proportions
3. **Processing Efficiency:** Execution Cores show reduced shape complexity compared to input
4. **Spatial Optimization:** Final output grid shows organized color distribution without overlaps
### Interpretation
This diagram illustrates a computational geometry processing system where raw input shapes are:
1. **Assigned** to overlapping bins (A nodes)
2. **Scheduled** for processing (S nodes)
3. **Transformed** through computational cores (P nodes)
4. **Output** as optimized grid-based representations
The bidirectional connections between Input Primitives and Populated Bins suggest an iterative refinement process. The final output's discrete color blocks indicate successful shape decomposition and spatial optimization. The system appears designed for parallel processing of geometric data with color-based feature preservation.
**Notable Pattern:** The 1:1 color ratio maintenance from input to output suggests the system preserves feature integrity while optimizing spatial arrangement.