## Bar Chart: Accuracy by Voting Method
### Overview
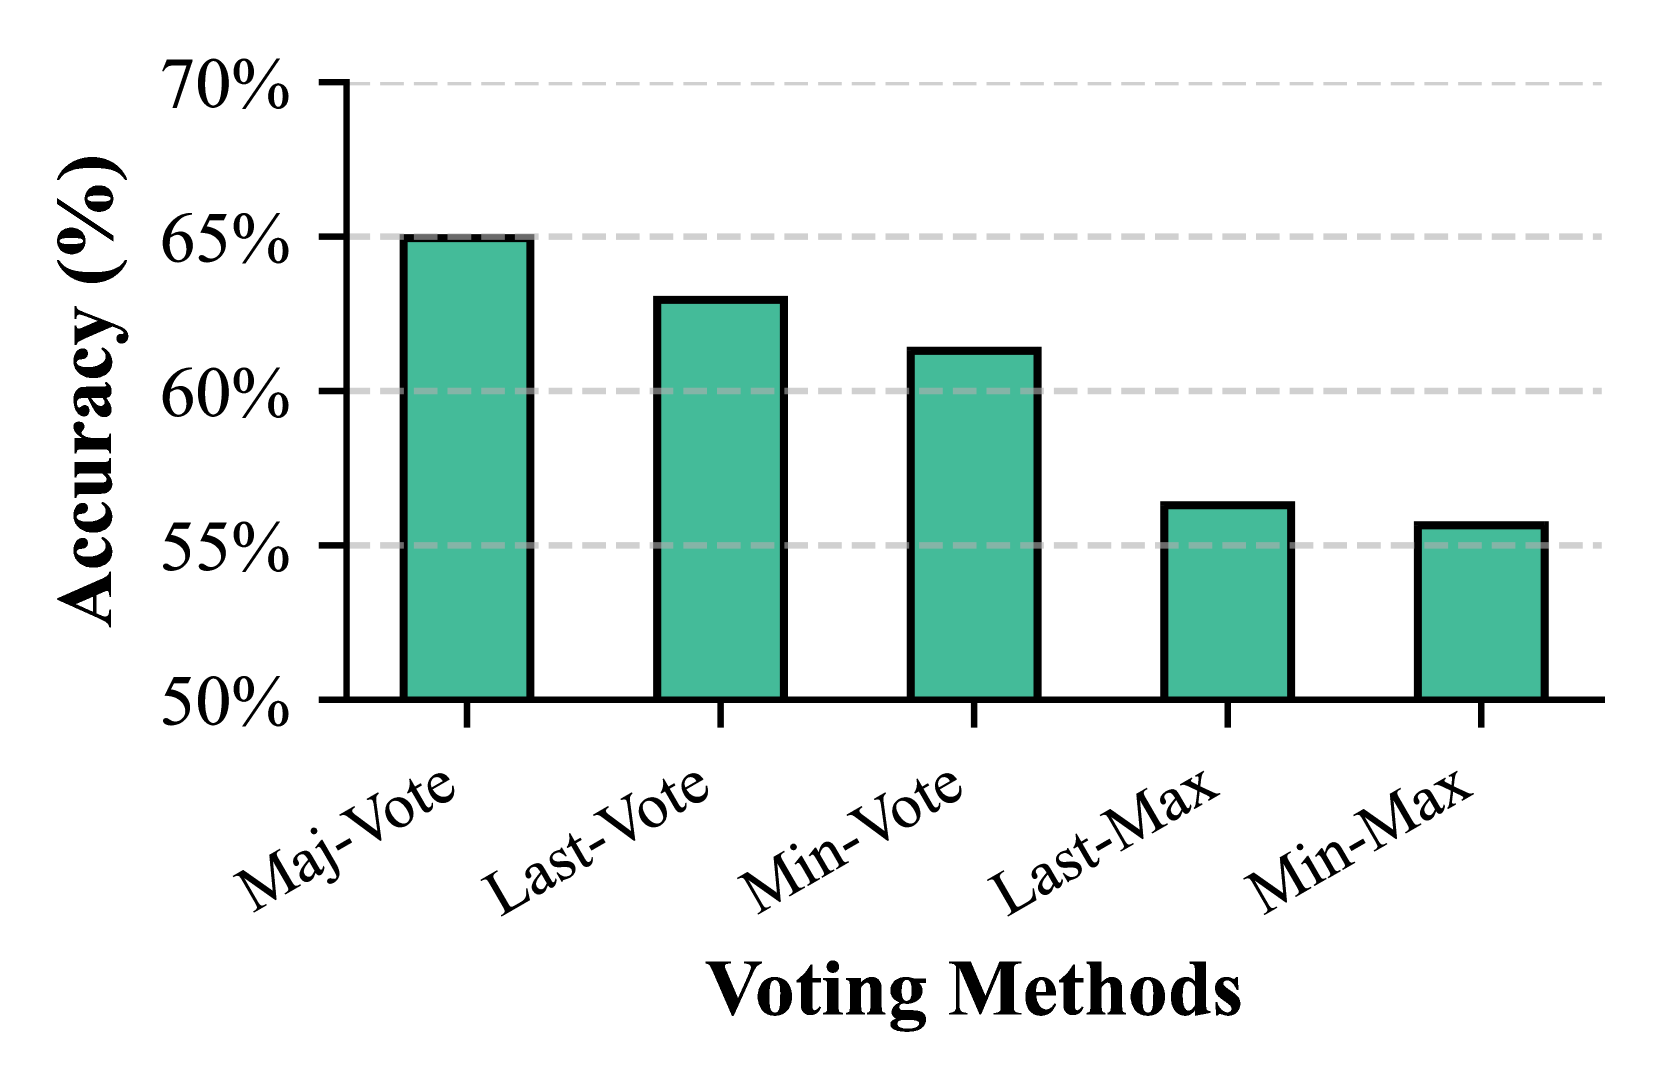
This image displays a bar chart comparing the accuracy of different voting methods. The chart shows five distinct voting methods on the x-axis and their corresponding accuracy percentages on the y-axis.
### Components/Axes
* **Y-axis Title**: "Accuracy (%)"
* **Scale**: Ranges from 50% to 70%, with major tick marks at 50%, 55%, 60%, 65%, and 70%.
* **Grid Lines**: Horizontal dashed lines are present at each major tick mark (50%, 55%, 60%, 65%, 70%) for easier reading.
* **X-axis Title**: "Voting Methods"
* **Categories**: The x-axis displays five categories representing different voting methods: "Maj-Vote", "Last-Vote", "Min-Vote", "Last-Max", and "Min-Max".
* **Bars**: Five vertical bars, all colored in a teal/cyan hue, represent the accuracy for each voting method.
### Detailed Analysis or Content Details
The chart presents the following data points for each voting method:
* **Maj-Vote**: The bar reaches approximately 65.2% accuracy.
* **Last-Vote**: The bar reaches approximately 63.2% accuracy.
* **Min-Vote**: The bar reaches approximately 61.8% accuracy.
* **Last-Max**: The bar reaches approximately 56.2% accuracy.
* **Min-Max**: The bar reaches approximately 55.8% accuracy.
### Key Observations
* The "Maj-Vote" method exhibits the highest accuracy among all tested methods.
* There is a general downward trend in accuracy as we move from "Maj-Vote" to "Min-Max", with a notable drop between "Min-Vote" and "Last-Max".
* "Last-Max" and "Min-Max" have very similar and the lowest accuracy scores.
### Interpretation
The data presented in this bar chart suggests that the "Maj-Vote" method is the most effective in terms of accuracy for the task or dataset represented. Conversely, "Last-Max" and "Min-Max" voting methods appear to be the least accurate. The observed trend indicates that simpler voting strategies like majority vote might yield better results compared to more complex or specific methods like "Last-Max" or "Min-Max" in this context. The significant drop in accuracy between "Min-Vote" and "Last-Max" could indicate a point where the voting strategy becomes less robust or suitable for the underlying data distribution. This visualization is crucial for selecting the optimal voting method for a given application, prioritizing accuracy.